6-K
2026--12-31falseQ20001944885June 30, 20260001944885ifrs-full:PreferenceSharesMember2026-06-300001944885aplm:InitialSupplyOfDrugProductMember2026-06-300001944885aplm:LicensePerformanceObligationMember2026-01-012026-06-300001944885ifrs-full:TopOfRangeMember2026-01-012026-06-300001944885aplm:PublicWarrantsMemberaplm:MaxproCapitalAcquisitionCorpMemberifrs-full:Level1OfFairValueHierarchyMember2025-12-3100019448852026-03-310001944885ifrs-full:PreferenceSharesMember2025-06-300001944885ifrs-full:BottomOfRangeMemberaplm:TwoThousandAndSixteenPlanMember2025-01-012025-06-300001944885aplm:DefinitiveSubscriptionAgreementsMemberaplm:ClassAOrdinarySharesMemberaplm:SubsequentEventsMember2026-08-142026-08-140001944885ifrs-full:IssuedCapitalMember2026-01-012026-06-300001944885aplm:ConvertibleNoteMember2026-03-300001944885ifrs-full:OrdinarySharesMember2025-12-310001944885ifrs-full:OrdinarySharesMember2024-12-310001944885ifrs-full:RestrictedShareUnitsMemberaplm:TwoThousandTwentyThreePlanMember2026-01-012026-06-300001944885aplm:TwoThousandAndSixteenPlanMemberifrs-full:ShareOptionsMember2026-01-012026-06-300001944885ifrs-full:BottomOfRangeMember2026-01-012026-06-300001944885ifrs-full:PreferenceSharesMember2024-12-310001944885ifrs-full:DiscountRateMeasurementInputMemberaplm:ConvertibleNoteMember2026-06-3000019448852024-12-310001944885ifrs-full:DiscountRateMeasurementInputMember2026-06-300001944885aplm:PennyWarrantsMemberaplm:PipeSubscriptionAgreementMemberifrs-full:Level3OfFairValueHierarchyMember2025-12-310001944885ifrs-full:IssuedCapitalMember2024-12-310001944885aplm:TwoThousandAndSixteenPlanMember2025-06-300001944885ifrs-full:DerivativesMemberaplm:ConvertibleNoteMember2026-03-300001944885aplm:HostLiabilityMember2026-03-310001944885ifrs-full:AtFairValueMember2026-01-012026-06-300001944885aplm:SubsequentEventsMember2026-09-142026-09-140001944885aplm:DefinitiveSubscriptionAgreementsMemberaplm:ClassAOrdinarySharesMemberaplm:SubsequentEventsMember2026-08-072026-08-070001944885aplm:ProjectMaxSpacMergerSubIncMember2026-01-012026-06-300001944885aplm:SettlementAgreementMember2025-11-192025-11-190001944885ifrs-full:RelatedPartiesMember2026-06-300001944885ifrs-full:InterestRateMeasurementInputMemberaplm:ConvertibleNoteMember2026-06-300001944885ifrs-full:RestrictedShareUnitsMemberaplm:TwoThousandTwentyThreePlanMember2025-01-012025-06-300001944885ifrs-full:RelatedPartiesMemberifrs-full:Level3OfFairValueHierarchyMemberaplm:ConvertibleNoteMember2026-01-012026-06-300001944885aplm:RestrictedShareAndRestrictedShareUnitAwardsMemberaplm:TwoThousandAndSixteenPlanMember2026-06-300001944885aplm:PrivateWarrantsMemberaplm:MaxproCapitalAcquisitionCorpMemberifrs-full:Level2OfFairValueHierarchyMember2026-01-012026-06-300001944885aplm:ConvertibleNoteMember2026-03-300001944885ifrs-full:ReserveOfSharebasedPaymentsMember2026-01-012026-06-300001944885ifrs-full:DerivativesMember2026-06-300001944885aplm:TwoThousandAndSixteenPlanMember2026-06-300001944885ifrs-full:TopOfRangeMemberaplm:TwoThousandAndSixteenPlanMember2025-06-300001944885ifrs-full:BottomOfRangeMemberaplm:TwoThousandAndSixteenPlanMember2025-06-300001944885aplm:ClassBOrdinarySharesMember2025-12-310001944885ifrs-full:DiscountRateMeasurementInputMemberaplm:ConvertibleNoteMember2026-03-300001944885ifrs-full:ShareOptionsMember2025-01-012025-06-300001944885aplm:TwoThousandAndSixteenPlanMember2025-12-310001944885aplm:ClassAOrdinarySharesMember2024-12-310001944885aplm:ClassAOrdinarySharesMember2025-12-310001944885ifrs-full:RetainedEarningsMember2026-06-300001944885aplm:DefinitiveSubscriptionAgreementsMemberaplm:ClassAOrdinarySharesMemberaplm:ConvertibleNoteMemberaplm:SubsequentEventsMember2026-08-072026-08-070001944885ifrs-full:TopOfRangeMember2025-06-300001944885ifrs-full:TopOfRangeMember2026-06-300001944885aplm:PrivateWarrantsMemberaplm:MaxproCapitalAcquisitionCorpMemberifrs-full:Level2OfFairValueHierarchyMember2025-12-310001944885ifrs-full:InterestRateMeasurementInputMemberaplm:ConvertibleNoteMember2026-03-300001944885aplm:PublicWarrantsMemberaplm:MaxproCapitalAcquisitionCorpMemberifrs-full:Level1OfFairValueHierarchyMember2026-01-012026-06-300001944885ifrs-full:OrdinarySharesMember2025-06-300001944885aplm:TwoThousandAndSixteenPlanMember2024-12-310001944885ifrs-full:RestrictedShareUnitsMemberaplm:TwoThousandTwentyThreePlanMember2025-06-300001944885srt:ChiefFinancialOfficerMemberaplm:SubsequentEventsMember2026-09-142026-09-140001944885aplm:RestrictedShareAndRestrictedShareUnitAwardsMemberaplm:TwoThousandAndSixteenPlanMember2025-01-012025-06-300001944885ifrs-full:AtFairValueMember2026-06-300001944885ifrs-full:RetainedEarningsMember2024-12-310001944885ifrs-full:SharePremiumMember2026-06-300001944885ifrs-full:ReserveOfSharebasedPaymentsMember2025-12-310001944885ifrs-full:RestrictedShareUnitsMemberaplm:TwoThousandTwentyThreePlanMember2024-12-310001944885ifrs-full:DerivativesMemberifrs-full:Level3OfFairValueHierarchyMember2025-12-310001944885aplm:OtherReserveExcluedingShareBasedPaymentReserveMember2025-06-300001944885ifrs-full:RelatedPartiesMember2025-12-310001944885aplm:ApollomicsIncTaiwanLimitedMember2026-01-012026-06-300001944885aplm:PennyWarrantsMember2026-01-012026-06-300001944885aplm:ZhejiangCrownBochuangBiopharmaCoLtdMember2026-01-012026-06-300001944885aplm:EmployeesMemberaplm:SubsequentEventsMember2026-09-142026-09-140001944885aplm:ClassBOrdinarySharesMember2026-06-300001944885aplm:ProbabilityOfConversionMemberifrs-full:AtFairValueMember2026-01-012026-06-300001944885aplm:SubsequentEventsMember2026-09-140001944885aplm:OtherReserveExcluedingShareBasedPaymentReserveMember2024-12-3100019448852025-12-3100019448852026-01-012026-06-300001944885aplm:TwoThousandAndSixteenPlanMemberaplm:ShareAppreciationRightsrestrictedShareUnitAwardsAndOtherAwardsMember2026-01-012026-06-3000019448852026-04-012026-06-300001944885ifrs-full:RestrictedShareUnitsMemberaplm:TwoThousandTwentyThreePlanMember2026-06-300001944885ifrs-full:ReserveOfSharebasedPaymentsMember2024-12-310001944885aplm:OtherReserveExcluedingShareBasedPaymentReserveMember2026-01-012026-06-3000019448852025-01-012025-06-300001944885aplm:RestrictedShareAndRestrictedShareUnitAwardsMemberaplm:TwoThousandAndSixteenPlanMember2025-06-300001944885aplm:ConvertibleNoteMember2026-06-300001944885aplm:HostLiabilityMemberaplm:ConvertibleNoteMember2026-03-300001944885ifrs-full:RetainedEarningsMember2025-06-300001944885aplm:ClassAOrdinarySharesMember2025-01-012025-06-300001944885aplm:TwoThousandAndSixteenPlanMemberaplm:RestrictedShareAwardsMember2026-01-012026-06-300001944885aplm:ApollomicsPrivateWarrantsMember2026-01-012026-06-300001944885aplm:HostLiabilityMemberaplm:ConvertibleNoteMember2026-04-012026-06-300001944885aplm:Credit-AdjustedDiscountRateMemberifrs-full:AtFairValueMember2026-01-012026-06-300001944885aplm:PennyWarrantsMemberaplm:PipeSubscriptionAgreementMemberifrs-full:Level3OfFairValueHierarchyMember2026-06-300001944885aplm:OtherReserveExcluedingShareBasedPaymentReserveMember2025-12-310001944885aplm:DefinitiveSubscriptionAgreementsMemberaplm:SubsequentEventsMember2026-08-072026-08-070001944885aplm:PublicWarrantsMemberaplm:MaxproCapitalAcquisitionCorpMemberifrs-full:Level1OfFairValueHierarchyMember2026-06-300001944885aplm:HostLiabilityMember2026-04-012026-06-300001944885aplm:ClassAOrdinarySharesMember2026-06-300001944885aplm:TwoThousandAndSixteenPlanMemberaplm:ShareAppreciationRightsrestrictedShareUnitAwardsAndOtherAwardsMember2025-01-012025-06-300001944885ifrs-full:RelatedPartiesMemberaplm:ConvertibleNoteMemberifrs-full:Level3OfFairValueHierarchyMember2026-06-300001944885aplm:HostLiabilityMember2026-03-300001944885aplm:ClassAOrdinarySharesMemberaplm:TwoThousandAndTwentyThreeIncentiveAwardPlanMember2026-06-300001944885ifrs-full:BottomOfRangeMember2026-06-300001944885ifrs-full:SharePremiumMember2024-12-310001944885ifrs-full:IssuedCapitalMember2025-01-012025-06-300001944885ifrs-full:IssuedCapitalMember2025-12-310001944885ifrs-full:Level3OfFairValueHierarchyMember2026-06-300001944885ifrs-full:DerivativesMember2026-03-310001944885ifrs-full:DerivativesMember2026-04-012026-06-300001944885aplm:OtherReserveExcluedingShareBasedPaymentReserveMember2026-06-300001944885ifrs-full:SharePremiumMember2025-06-300001944885aplm:ApollomicsPrivateWarrantsMember2025-01-012025-06-300001944885aplm:PrivateWarrantsMemberaplm:MaxproCapitalAcquisitionCorpMemberifrs-full:Level2OfFairValueHierarchyMember2026-06-300001944885aplm:UnvestedRestrictedSharesMember2025-01-012025-06-300001944885aplm:SettlementAgreementMember2026-01-012026-06-300001944885aplm:InitialSupplyOfDrugProductMember2026-01-012026-06-300001944885ifrs-full:IssuedCapitalMember2025-06-300001944885aplm:LicensePerformanceObligationMember2026-06-300001944885aplm:PennyWarrantsMember2025-01-012025-06-300001944885ifrs-full:OrdinarySharesMember2026-06-300001944885aplm:ApollomicsHongKongLimitedMember2026-01-012026-06-300001944885country:CN2025-12-310001944885ifrs-full:RetainedEarningsMember2026-01-012026-06-300001944885aplm:RestrictedShareAndRestrictedShareUnitAwardsMemberaplm:TwoThousandAndSixteenPlanMember2026-01-012026-06-300001944885aplm:HostLiabilityMember2026-03-302026-03-300001944885aplm:ClassBOrdinarySharesMember2024-12-310001944885ifrs-full:DerivativesMemberifrs-full:Level3OfFairValueHierarchyMember2026-06-300001944885aplm:ZhejiangCrownmabBiotechCoLtdMember2026-01-012026-06-300001944885ifrs-full:ReserveOfSharebasedPaymentsMember2025-06-300001944885aplm:TimeBasedShareOptionsMemberaplm:TwoThousandAndSixteenPlanMember2026-01-012026-06-300001944885aplm:LaunXPInternationalMember2026-01-012026-06-300001944885ifrs-full:SharePremiumMember2025-12-310001944885ifrs-full:RetainedEarningsMember2025-01-012025-06-3000019448852025-06-300001944885aplm:ApollomicsIncMember2026-01-012026-06-300001944885ifrs-full:SharePremiumMember2026-01-012026-06-300001944885ifrs-full:TopOfRangeMemberaplm:TwoThousandAndSixteenPlanMember2025-01-012025-06-300001944885aplm:HostLiabilityMember2026-06-300001944885ifrs-full:ShareOptionsMember2026-01-012026-06-300001944885country:CN2026-06-300001944885ifrs-full:RestrictedShareUnitsMemberaplm:TwoThousandTwentyThreePlanMember2025-12-310001944885aplm:ApollomicsPublicWarrantsMember2026-01-012026-06-300001944885aplm:UnvestedRestrictedSharesMember2026-01-012026-06-300001944885ifrs-full:DerivativesMemberifrs-full:Level3OfFairValueHierarchyMember2026-01-012026-06-300001944885ifrs-full:IssuedCapitalMember2026-06-300001944885aplm:LaunXPInternationalMember2025-03-012025-03-310001944885ifrs-full:ReserveOfSharebasedPaymentsMember2025-01-012025-06-300001944885aplm:TwoThousandAndSixteenPlanMember2026-01-012026-06-300001944885aplm:PennyWarrantsMemberaplm:PipeSubscriptionAgreementMemberifrs-full:Level3OfFairValueHierarchyMember2026-01-012026-06-300001944885ifrs-full:RetainedEarningsMember2025-12-3100019448852026-06-300001944885aplm:SettlementAgreementMember2026-06-300001944885aplm:TwoThousandAndSixteenPlanMember2025-01-012025-06-300001944885aplm:ApollomicsAustraliaPtyLtdMember2026-01-012026-06-300001944885srt:DirectorMemberaplm:SubsequentEventsMember2026-09-142026-09-140001944885aplm:DefinitiveSubscriptionAgreementsMemberaplm:ConvertibleNoteMemberaplm:SubsequentEventsMember2026-08-072026-08-070001944885ifrs-full:BottomOfRangeMember2025-06-300001944885aplm:ConvertibleNoteMember2026-03-302026-03-300001944885aplm:ClassAOrdinarySharesMember2025-06-300001944885ifrs-full:PreferenceSharesMember2025-12-310001944885aplm:ClassBOrdinarySharesMember2025-06-300001944885ifrs-full:ReserveOfSharebasedPaymentsMember2026-06-300001944885srt:ChiefOperatingOfficerMemberaplm:SubsequentEventsMember2026-09-142026-09-140001944885srt:ChiefExecutiveOfficerMemberaplm:SubsequentEventsMember2026-09-142026-09-140001944885aplm:ApollomicsPublicWarrantsMember2025-01-012025-06-30xbrli:pureaplm:Employeexbrli:sharesaplm:PerformanceObligationsiso4217:USDutr:Yaplm:BoardMember
UNITED STATES
SECURITIES AND EXCHANGE COMMISSION
Washington, D.C. 20549
FORM 6-K
REPORT OF FOREIGN PRIVATE ISSUER
PURSUANT TO RULE 13a-16 OR 15d-16
UNDER THE SECURITIES EXCHANGE ACT OF 1934
For the Month of November 2026
Commission File Number: 001-41670
Apollomics Inc.
(Translation of registrant’s name into English)
989 E. Hillsdale Blvd., Suite 220
Foster City, CA 94404
Telephone: (650) 209-4055
(Address of principal executive office)
Indicate by check mark whether the registrant files or will file annual reports under cover of Form 20-F or Form 40-F:
Form 20-F ☒ Form 40-F ☐
EXPLANATORY NOTE
On November 6, 2026, Apollomics Inc. (the “Company”) issued unaudited condensed consolidated interim financial statements for the six months ended June 30, 2026 and management’s discussion and analysis of financial condition and results of operations (the “MD&A”) for the six months ended June 30, 2026. A copy of such unaudited condensed consolidated interim financial statements is attached hereto as Exhibit 99.1. A copy of the MD&A is attached hereto as Exhibit 99.2.
The information furnished in Exhibit 99.1 and Exhibit 99.2 to this Report of Foreign Private Issuer on Form 6-K (this “Report”) shall be deemed to be filed with the Securities and Exchange Commission and incorporated by reference into the Company’s registration statements on Form S-8 (File No. 333-272559 and 333-293148) and Form F-3 (File Nos. 333-278430, 333-278431, 333-279549, and 333-294154), and any related prospectuses, as such registration statements and prospectuses may be amended from time to time, and to be a part thereof from the date on which this Report is filed, to the extent not superseded by documents or reports subsequently filed or furnished.
APPLICATION OF HOME COUNTRY PRACTICE RULES
The Company is a “foreign private issuer” (as such term is defined in Rule 3b-4 under the Securities Exchange Act of 1934, as amended (the “Exchange Act”)) and the Company’s Class A ordinary shares, par value $0.01 per share (each a “Class A Ordinary Share”), and warrants are listed on the Nasdaq Capital Market. As a foreign private issuer, the Company is permitted under Nasdaq rules to follow home country governance practices instead of certain Nasdaq requirements pursuant to Nasdaq Rule 5615(a)(3). As disclosed in the Company’s annual report on Form 20-F for the fiscal year ended December 31, 2025, as filed with the U.S. Securities and Exchange Commission on April 24, 2026 (the “Annual Report”), the Company follows home country corporate governance practices instead of certain Nasdaq corporate governance requirements, as described in more detail therein. The Company has also informed Nasdaq that it intends to follow home country governance practices in lieu of shareholder approval requirements in Nasdaq Rule 5635, and that it will disclose in its annual report on Form 20-F for the fiscal year ended December 31, 2026 each requirement that it does not follow and describe the home country practices it follows in lieu of such requirements.
SIGNATURES
Pursuant to the requirements of the Securities Exchange Act of 1934, the registrant has duly caused this report to be signed on its behalf by the undersigned, thereunto duly authorized.
|
|
|
|
|
Apollomics Inc. |
Date: November 6, 2026 |
By: |
/s/ Hung Wen (Howard) Chen |
|
|
Name |
Hung Wen (Howard) Chen |
|
|
Title: |
Chief Executive Officer |
EX-99.1
Exhibit 99.1
INDEX TO UNAUDITED CONDENSED CONSOLIDATED INTERIM FINANCIAL STATEMENTS
APOLLOMICS INC.
UNAUDITED CONDENSED CONSOLIDATED INTERIM STATEMENTS OF FINANCIAL POSITION
(All amounts in thousands of $)
|
|
|
|
|
|
|
|
|
|
|
|
|
NOTES |
|
As of June 30, 2026 (Unaudited) |
|
|
As of December 31, 2025 |
|
Non-current assets |
|
|
|
|
|
|
|
|
Plant and equipment, net |
|
|
|
$ |
— |
|
|
$ |
3 |
|
Right-of-use assets |
|
10 |
|
|
486 |
|
|
|
577 |
|
Rental deposits |
|
|
|
|
82 |
|
|
|
83 |
|
Total non-current assets |
|
|
|
|
568 |
|
|
|
663 |
|
|
|
|
|
|
|
|
|
|
Current assets |
|
|
|
|
|
|
|
|
Deposits, prepayments and deferred expenses |
|
11 |
|
|
635 |
|
|
|
470 |
|
Accounts receivable |
|
5 |
|
|
— |
|
|
|
2,305 |
|
Cash and cash equivalents |
|
12 |
|
|
1,011 |
|
|
|
3,276 |
|
Total current assets |
|
|
|
|
1,646 |
|
|
|
6,051 |
|
|
|
|
|
|
|
|
|
|
Total assets |
|
|
|
|
2,214 |
|
|
|
6,714 |
|
|
|
|
|
|
|
|
|
|
Current liabilities |
|
|
|
|
|
|
|
|
Convertible note, related party |
|
15 |
|
|
1,658 |
|
|
|
— |
|
Derivative liability, related party |
|
15, 18 |
|
|
732 |
|
|
|
— |
|
Other payables and accruals |
|
13 |
|
|
8,696 |
|
|
|
6,117 |
|
Lease liabilities, current portion |
|
|
|
|
177 |
|
|
|
209 |
|
Total current liabilities |
|
|
|
|
11,263 |
|
|
|
6,326 |
|
|
|
|
|
|
|
|
|
|
Net current liabilities |
|
|
|
|
(9,617 |
) |
|
|
(275 |
) |
|
|
|
|
|
|
|
|
|
Total assets less current liabilities |
|
|
|
|
(9,049 |
) |
|
|
388 |
|
|
|
|
|
|
|
|
|
|
Non-current liabilities |
|
|
|
|
|
|
|
|
Lease liabilities, non-current portion |
|
|
|
|
364 |
|
|
|
434 |
|
Warrant liabilities at fair value through profit and loss (“FVTPL”) |
|
18 |
|
|
222 |
|
|
|
124 |
|
Other non-current liabilities |
|
14 |
|
|
1,518 |
|
|
|
3,018 |
|
Total non-current liabilities |
|
|
|
|
2,104 |
|
|
|
3,576 |
|
|
|
|
|
|
|
|
|
|
Net liabilities |
|
|
|
|
(11,153 |
) |
|
|
(3,188 |
) |
|
|
|
|
|
|
|
|
|
Equity |
|
|
|
|
|
|
|
|
Share capital |
|
16 |
|
|
22 |
|
|
|
21 |
|
Share premium |
|
|
|
|
670,551 |
|
|
|
670,384 |
|
Reserves |
|
|
|
|
38,810 |
|
|
|
38,169 |
|
Accumulated deficits |
|
|
|
|
(720,536 |
) |
|
|
(711,762 |
) |
Total deficit |
|
|
|
$ |
(11,153 |
) |
|
$ |
(3,188 |
) |
The accompanying notes are an integral part of these unaudited condensed consolidated interim financial statements.
APOLLOMICS INC.
UNAUDITED CONDENSED CONSOLIDATED INTERIM STATEMENTS OF OPERATIONS AND COMPREHENSIVE LOSS
(All amounts in thousands of $, except for per share data)
|
|
|
|
|
|
|
|
|
|
|
|
|
|
|
Six Months Ended June 30, |
|
|
|
NOTES |
|
2026 |
|
|
2025 |
|
Revenue |
|
5 |
|
$ |
— |
|
|
$ |
8,500 |
|
Other income |
|
|
|
|
154 |
|
|
|
83 |
|
Foreign exchange losses |
|
6 |
|
|
(42 |
) |
|
|
(77 |
) |
Fair value change of financial liabilities at FVTPL |
|
15, 18 |
|
|
(60 |
) |
|
|
(384 |
) |
Research and development expenses |
|
|
|
|
(1,971 |
) |
|
|
(4,620 |
) |
Administrative expenses |
|
|
|
|
(4,467 |
) |
|
|
(14,488 |
) |
Impairment of intangible assets |
|
|
|
|
— |
|
|
|
(1,500 |
) |
Finance costs |
|
|
|
|
(87 |
) |
|
|
(35 |
) |
Impairment loss on financial assets – expected credit loss |
|
5 |
|
|
(2,300 |
) |
|
|
— |
|
Other expense |
|
7 |
|
|
— |
|
|
|
(14 |
) |
Loss before taxation |
|
|
|
|
(8,773 |
) |
|
|
(12,535 |
) |
Income tax expenses |
|
|
|
|
(1 |
) |
|
|
(1 |
) |
Loss and total comprehensive loss for the period, net of taxation,
attributable to owners of the Company |
|
|
|
$ |
(8,774 |
) |
|
$ |
(12,536 |
) |
Loss per share |
|
|
|
|
|
|
|
|
Basic and Diluted loss per common share |
|
9 |
|
$ |
(4.04 |
) |
|
$ |
(11.37 |
) |
Weighted average number of common shares outstanding – Basic and Diluted |
|
9 |
|
|
2,174 |
|
|
|
1,103 |
|
The accompanying notes are an integral part of these unaudited condensed consolidated interim financial statements.
APOLLOMICS INC.
UNAUDITED CONDENSED CONSOLIDATED INTERIM STATEMENTS OF SHAREHOLDERS’ EQUITY (DEFICIT)
(All amounts in thousands of $, except for share and per share data)
|
|
|
|
|
|
|
|
|
|
|
|
|
|
|
|
|
|
|
|
|
|
|
|
|
|
|
|
|
|
|
Share capital |
|
|
|
|
|
Reserves |
|
|
|
|
|
|
|
|
|
|
|
|
|
|
|
|
|
|
|
|
|
Share-based |
|
|
|
|
|
|
|
|
|
Number of
Shares |
|
|
Amount |
|
|
Share premium |
|
|
Other
reserve |
|
|
payment
reserve |
|
|
Accumulated losses |
|
|
Total |
|
|
|
|
|
|
|
|
|
|
|
|
(note) |
|
|
|
|
|
|
|
|
|
|
As of January 1, 2025 |
|
|
1,102,792 |
|
|
|
11 |
|
|
|
666,528 |
|
|
|
3,435 |
|
|
|
35,713 |
|
|
|
(700,823 |
) |
|
|
4,864 |
|
Loss and total comprehensive loss for the period |
|
— |
|
|
— |
|
|
— |
|
|
— |
|
|
— |
|
|
|
(12,536 |
) |
|
|
(12,536 |
) |
Shares issued to board members for board fees (Note 16) |
|
|
556 |
|
|
|
— |
|
|
— |
|
|
— |
|
|
— |
|
|
— |
|
|
|
— |
|
Recognition of equity-settled share-based payment (Note 17) |
|
|
— |
|
|
— |
|
|
— |
|
|
— |
|
|
|
3,274 |
|
|
— |
|
|
|
3,274 |
|
As of June 30, 2025 |
|
|
1,103,348 |
|
|
$ |
11 |
|
|
$ |
666,528 |
|
|
$ |
3,435 |
|
|
$ |
38,987 |
|
|
$ |
(713,359 |
) |
|
$ |
(4,398 |
) |
|
|
|
|
|
|
|
|
|
|
|
|
|
|
|
|
|
|
|
|
|
|
As of January 1, 2026 |
|
|
2,147,105 |
|
|
|
21 |
|
|
|
670,384 |
|
|
|
3,435 |
|
|
|
34,734 |
|
|
|
(711,762 |
) |
|
|
(3,188 |
) |
Loss and total comprehensive loss for the period |
|
— |
|
|
— |
|
|
— |
|
|
— |
|
|
— |
|
|
|
(8,774 |
) |
|
|
(8,774 |
) |
Deemed distribution to a related party (Note 15) |
|
— |
|
|
— |
|
|
— |
|
|
|
(376 |
) |
|
— |
|
|
— |
|
|
|
(376 |
) |
Shares issued to employees for compensation (Note 16) |
|
|
48,730 |
|
|
|
1 |
|
|
|
(1 |
) |
|
— |
|
|
— |
|
|
— |
|
|
|
— |
|
Shares issued to board members for board fees (Note 16) |
|
|
7,138 |
|
|
|
— |
|
|
|
— |
|
|
— |
|
|
— |
|
|
— |
|
|
|
— |
|
Exercise of share options |
|
|
11,991 |
|
|
|
— |
|
|
|
168 |
|
|
— |
|
|
— |
|
|
— |
|
|
|
168 |
|
Recognition of equity-settled share-based payment (Note 17) |
|
|
— |
|
|
— |
|
|
— |
|
|
— |
|
|
|
1,017 |
|
|
— |
|
|
|
1,017 |
|
As of June 30, 2026 |
|
|
2,214,964 |
|
|
$ |
22 |
|
|
$ |
670,551 |
|
|
$ |
3,059 |
|
|
$ |
35,751 |
|
|
$ |
(720,536 |
) |
|
$ |
(11,153 |
) |
Note: Other reserve includes amounts transferred from share-based payment reserve when the share options are exercised or the restricted shares are vested, and the deemed distribution to a related party described in Note 15.
The accompanying notes are an integral part of these unaudited condensed consolidated interim financial statements.
APOLLOMICS INC.
UNAUDITED CONDENSED CONSOLIDATED interim STATEMENTS OF CASH FLOWS
(All amounts in thousands of $)
|
|
|
|
|
|
|
|
|
|
|
For the Six Months Ended June 30, |
|
|
|
2026 |
|
|
2025 |
|
OPERATING ACTIVITIES |
|
|
|
|
|
|
Loss before taxation |
|
$ |
(8,773 |
) |
|
$ |
(12,535 |
) |
Adjustments for: |
|
|
|
|
|
|
Depreciation of plant and equipment |
|
|
3 |
|
|
|
18 |
|
Amortization of right-of-use assets |
|
|
91 |
|
|
|
115 |
|
Amortization of intangible assets |
|
|
— |
|
|
|
10 |
|
Impairment loss on financial assets (expected credit loss) |
|
|
2,300 |
|
|
|
— |
|
Impairment losses on intangible assets |
|
|
— |
|
|
|
1,500 |
|
Right-of-use assets and associated lease liabilities write-off |
|
|
— |
|
|
|
7 |
|
Fair value change of financial liabilities at FVTPL |
|
|
60 |
|
|
|
384 |
|
Finance costs |
|
|
87 |
|
|
|
35 |
|
Share-based payment expenses |
|
|
1,017 |
|
|
|
3,274 |
|
Losses on disposal of property and equipment |
|
|
— |
|
|
|
15 |
|
Operating cash flows before movements in working capital |
|
|
(5,215 |
) |
|
|
(7,177 |
) |
Decrease (Increase) in deposits, prepayments and deferred expenses, and accounts receivable |
|
|
(159 |
) |
|
|
(7,541 |
) |
Increase in other payables and accruals, and other non-current liabilities |
|
|
1,078 |
|
|
|
7,095 |
|
NET CASH USED IN OPERATION |
|
|
(4,296 |
) |
|
|
(7,623 |
) |
Taxation paid |
|
|
(1 |
) |
|
|
(1 |
) |
NET CASH USED IN OPERATING ACTIVITIES |
|
|
(4,297 |
) |
|
|
(7,624 |
) |
INVESTING ACTIVITIES |
|
|
|
|
|
|
Proceeds from disposal of plant and equipment |
|
|
— |
|
|
|
48 |
|
NET CASH PROVIDED BY INVESTING ACTIVITIES |
|
|
— |
|
|
|
48 |
|
FINANCING ACTIVITIES |
|
|
|
|
|
|
Proceeds from issuance of convertible note, net of issuance costs |
|
|
1,991 |
|
|
|
— |
|
Proceeds from issue of shares upon exercise of share options |
|
|
168 |
|
|
|
— |
|
Interest paid |
|
|
(25 |
) |
|
|
(35 |
) |
Repayment of lease liabilities |
|
|
(103 |
) |
|
|
(47 |
) |
NET CASH PROVIDED BY (USED IN) FINANCING ACTIVITIES |
|
|
2,031 |
|
|
|
(82 |
) |
Effects of Exchange Rate Changes on Cash and Cash Equivalents |
|
|
1 |
|
|
|
(14 |
) |
NET (DECREASE) IN CASH AND CASH EQUIVALENTS |
|
|
(2,265 |
) |
|
|
(7,672 |
) |
CASH AND CASH EQUIVALENTS AT THE BEGINNING OF THE PERIOD |
|
|
3,276 |
|
|
|
9,766 |
|
CASH AND CASH EQUIVALENTS AT THE END OF THE PERIOD |
|
$ |
1,011 |
|
|
$ |
2,094 |
|
NON-CASH INVESTING AND FINANCING ACTIVITIES: |
|
|
|
|
|
|
Deemed distribution to a related party – excess of the fair value of the convertible note over the proceeds (Note 15) |
|
|
376 |
|
|
|
— |
|
Reconciliation of movement in lease right-of-use assets and associated lease liabilities |
|
|
— |
|
|
|
142 |
|
The accompanying notes are an integral part of these unaudited condensed consolidated interim financial statements.
APOLLOMICS INC.
Notes to Unaudited Condensed Consolidated Interim Financial Statements
Apollomics Inc. (“Apollomics” or the “Company”) is a clinical-stage biotechnology company focused on discovering and developing oncology therapies to address unmet medical needs, especially for difficult-to-treat and treatment-resistant cancers. Since our founding in 2015, the Company has built a pipeline of five drug candidates across 10 programs that focus on oncology, of which four drug candidates are in the clinical stage.
The Company was originally formed as CB Therapeutics Inc. as a result of a spin-off from Crown Bioscience International, which was completed on December 31, 2015. Prior to December 2015, Crown Bioscience International, through its subsidiaries, was the owner of certain patent rights relating to certain of these drug candidates. In order to focus on its core business, namely providing preclinical contract research organization services, and allow the drug discovery and development related business to be operated and financed separately, Crown Bioscience International spun off its Taiwan subsidiary, Crown Bioscience (Taiwan), and contributed it to the Company. As a result, the Company became the owner of these patent rights.
In addition to its U.S. headquarters, the Company also has locations in Australia (Apollomics (Australia) Pty Ltd, formed in November 2016), Hong Kong (Apollomics (Hong Kong) Limited, formed in June 2019), Apollomics Inc. (Taiwan) Limited and China (Zhejiang Crownmab Biotech Co. Ltd. and Zhejiang Crown Bochuang Biopharma Co. Ltd., formed in May 2018 and May 2020, respectively). The Company’s headquarters and global drug development team is based in the United States (San Francisco Bay area), and its China drug development team is based in China (Hangzhou and Shanghai).
The unaudited condensed consolidated interim financial statements are presented in U.S. dollars (“$”). The Company’s subsidiaries included in the unaudited condensed consolidated interim financial statements are listed below (the Company and its subsidiaries are collectively referred to herein as the “Group”). These unaudited condensed consolidated interim financial statements have been prepared based on the accounting policies which conform with International Financial Reporting Standards (“IFRSs”) as issued by the International Accounting Standards Board (“IASB”) and have been prepared under the assumption the Company operates on a going concern basis.
|
|
|
Name of subsidiaries |
Place of incorporation or establishment/operation and date of incorporation/ establishment |
Principal activities |
Apollomics, Inc. |
California, United States
January 14, 2016 |
Research and development of drugs |
Apollomics (Australia) Pty. Ltd. |
Melbourne, Australia
November 4, 2016 |
Research and development of drugs |
Apollomics (Hong Kong) Limited |
Hong Kong, China
June 24, 2019 |
Management and administrative services |
Apollomics Inc. (Taiwan) Limited |
Taipei, Taiwan
February 13, 2026 |
Management and administrative services |
Zhejiang Crownmab Biotech Co., Ltd. |
Hangzhou, China
May 29, 2018 |
Research and development of drugs |
Zhejiang Crown Bochuang Biopharma Co., Ltd. |
Hangzhou, China
May 29, 2020 |
Research and development of drugs |
Project Max SPAC Merger Sub, Inc. |
Delaware, United States
August 19, 2022 |
Investment holding |
2.BASIS OF PREPARATION OF THE UNAUDITED CONDENSED CONSOLIDATED interim FINANCIAL STATEMENTS AND GOING CONCERN
As of and for the six months ended June 30, 2026, the Group had reported a net loss of $8.8 million, and accumulated losses of $720.5 million and net current liabilities of $9.6 million. The Group regularly monitors its current and expected liquidity requirements and, as needed, updates its operating plans, to ensure that it maintains sufficient cash balances to meet its liquidity requirements in the short and long term.
Based on our evaluation of conditions and events as of June 30, 2026, management has determined that substantial doubt exists about the Company’s ability to continue as a going concern. As of that date, we had cash and cash equivalents of $1.0 million, a history of recurring losses and negative shareholders’ equity, and limited liquidity relative to our operating requirements. Although we implemented cost-reduction initiatives beginning in early 2024 and continuing through 2026, and expect liquidity support from financing activities and strategic partnerships, our existing cash resources are not sufficient to meet our obligations as they come due for at least twelve months from the end of the reporting period. Management’s plans to address this shortfall include raising additional capital through equity or debt financing and generating cash inflows from
APOLLOMICS INC.
Notes to Unaudited Condensed Consolidated Interim Financial Statements
strategic partnerships; however, these plans, except as described in Note 22, are not contractually committed, are subject to external factors and there can be no assurance that it will be available on acceptable terms, or at all. These conditions indicate the existence of material uncertainties that may cast substantial doubt on the Company’s ability to continue as a going concern.
Notwithstanding these material uncertainties, the accompanying financial statements have been prepared on a going concern basis of accounting and do not include any adjustments to the carrying amounts and classification of assets and liabilities that may be necessary in the event that the Company is no longer able to continue its operations as a going concern.
The unaudited condensed consolidated interim financial statements have been prepared in accordance with International Accounting Standard 34 (“IAS 34”) “Interim Financial Reporting” issued by the IASB as well as the rules and regulations of the U.S. Securities and Exchange Commission, and have been prepared under the assumption the Group operates on a going concern basis, which contemplates the realization of assets and satisfaction of liabilities and commitments in the ordinary course of business.
3.PRINCIPAL ACCOUNTING POLICIES
The unaudited condensed consolidated interim financial statements have been prepared on the historical cost basis except for certain financial instruments, which are measured at fair values.
Other than additional accounting policies resulting from application of amendments to IFRSs, the accounting policies and methods of computation used in the unaudited condensed consolidated interim financial statements for the six months ended June 30, 2025 and 2026 are the same as those presented in the Group’s annual financial statements for the year ended December 31, 2025.
Application of amendments to IFRSs
There were no new or amended IFRSs that became effective for the first time and were applicable to the Group for the six months ended June 30, 2026. The amendments listed below were already adopted by the Group in a prior period, as reflected in the Group’s annual financial statements for the year ended December 31, 2025, and are shown here for reference only:
|
|
Amendments to IFRS 3 |
Reference to the Conceptual Framework |
Amendments to IAS 16 |
Property, Plant and Equipment: Proceeds before Intended Use |
Amendments to IAS 21 |
The Effects of Changes in Foreign Exchange Rates |
IFRIC agenda decision |
Guarantees Issued on Obligations of Other Entities |
The application of the amendments to IFRSs in the current interim period has had no material impact on the Group’s financial position and performance for the current and prior periods and/or on the disclosures set out in these unaudited condensed consolidated interim financial statements.
New standards, amendments and interpretations not yet adopted by the Group
Certain standards, amendments and interpretations have been published through the June 30, 2026 reporting period and have not been early adopted by the Group. These are as follows:
•IFRS 18, Presentation and Disclosure in Financial Statements;
•IFRS 19, Subsidiaries without Public Accountability; and
•Amendments to IAS 21, Translation to a Hyperinflationary Presentation Currency.
The Group intends to adopt these new standards, amendments and interpretations, if applicable, when they become effective, and does not expect them to have a material impact on its financial statements.
4.CRITICAL ACCOUNTING JUDGMENTS AND KEY SOURCES OF ESTIMATION UNCERTAINTY
The preparation of the unaudited condensed consolidated interim financial statements requires the management of the Group to make judgments, estimates and assumptions that affect the application of accounting policies and the reported amounts
APOLLOMICS INC.
Notes to Unaudited Condensed Consolidated Interim Financial Statements
of assets and liabilities, income and expense. The estimates and underlying assumptions are based on historical experience and other factors that are considered to be relevant. Actual results may differ from these estimates.
In preparing these unaudited condensed consolidated interim financial statements, the critical judgments made by the management of the Group in applying the Group’s accounting policies and the key sources of estimation uncertainty were the same as those that applied to the consolidated financial statements for the year ended December 31, 2025.
5.REVENUE AND SEGMENT INFORMATION
Revenue
In March 2025, Apollomics entered into an agreement for the development and commercialization in Asia (excluding mainland China, Hong Kong and Macau) of vebreltinib, Apollomics’ proprietary c-Met inhibitor, in combination with an EGFR inhibitor (“EGFRi”) for the treatment of non-small cell lung cancer (“NSCLC”) and other tumor types with LaunXP International Co., Ltd. (“LaunXP”). Under the terms of the LaunXP agreement (“the Agreement”), Apollomics was to receive upfront payments totaling $10 million. Apollomics was also eligible for regulatory and other pre-commercial milestone payments of up to $50 million, and royalties on net product sales at a rate of 11%. Such royalties were payable on a Licensed Product-by-Licensed Product and Region-by-Region basis from first commercial sale and continue, in each case, until the latest of patent expiration, expiration of regulatory exclusivity, or fifteen years following first commercial sale in the applicable region. LaunXP was to be primarily responsible for the development of vebreltinib in combination with an EGFRi in the LaunXP territory (all countries in Asia other than mainland China, Hong Kong and Macau) for the treatment of NSCLC.
The Group determined that the Agreement and the supply activities and materials transfer fall within the scope of IFRS 15. In calculating the transaction price, it determined the following two performance obligations under the agreement: (i) provide exclusive license and (ii) provide initial drug supply.
The Group allocated the transaction price to the performance obligations as of June 30, 2026 as follows:
|
|
|
|
|
|
|
|
|
|
|
|
|
|
|
Transaction price |
|
|
Revenue recognized for the six months ended June 30, 2026 |
|
|
Cumulative revenue recognized as of June 30, 2026 |
|
(In thousands) |
|
|
|
|
|
|
|
|
|
License |
|
$ |
8,500 |
|
|
$ |
— |
|
|
$ |
8,500 |
|
Initial supply |
|
|
1,500 |
|
|
|
— |
|
|
|
— |
|
|
|
$ |
10,000 |
|
|
$ |
— |
|
|
$ |
8,500 |
|
For each of the performance obligations described above, the Group has determined the following methods of revenue recognition:
License: The Group recognizes revenue from the license at a point in time. Upon signing the LaunXP Agreement and transferring the license know-how, the Group no longer had any rights to the license in the LaunXP territory, and the Group did not have the obligation to improve, modify or update the license transferred. As such, there was no significant continued involvement in the license provided. LaunXP can begin to use and benefit from the license after the effective date of the Agreement and transfer of the license know-how as they were now the ‘owner’ of the underlying patents and know-how in the LaunXP territory. The transaction price allocated to the license performance obligation was determined using the residual approach, as the standalone selling price of the license is highly variable. In connection with the license performance obligation, the Group recognized revenue of nil for the six months ended June 30, 2026.
Initial clinical supply: The Group was responsible for providing LaunXP with the initial clinical trial drug supply. It was obligated to transfer this initial supply to LaunXP in accordance with the development plan. The Group has not transferred the initial supply of drug product to LaunXP as of June 30, 2026, and therefore has not triggered the recognition of revenue at the point in time.
As of June 30, 2026, the Group had received $6.2 million of the upfront payment and had recorded $2.3 million in accounts receivable on the unaudited condensed consolidated statements of financial position. LaunXP failed to remit the remaining upfront payment balance of $3.8 million (comprising the receivable described above and the deferred consideration allocated to the initial clinical supply obligation) together with applicable interest, and did not cure this failure. Effective June 11, 2026, the Group formally terminated the Agreement, and all licenses previously granted to LaunXP automatically and immediately terminated. LaunXP has expressed disagreement with the termination, and on June 18, 2026 the Group initiated the dispute resolution process contractually mandated under the Agreement. The Agreement does not identify any collateral, guarantee, or other security supporting the receivable, and the Group does not believe that any amount will be recovered. Accordingly, the Group determined the receivable to be credit-impaired under IFRS 9 and recorded a full impairment loss of $2.3 million, presented as a separate line item, “Impairment loss on financial assets – expected credit loss,” on the unaudited condensed consolidated interim statements of operations and comprehensive loss for the six months ended June 30, 2026. As
APOLLOMICS INC.
Notes to Unaudited Condensed Consolidated Interim Financial Statements
of June 30, 2026, the receivable is fully reserved and is reflected at nil, net of the allowance for expected credit losses, on the unaudited condensed consolidated statements of financial position. The Group continues to pursue collection through the dispute resolution process and will reverse the allowance if it later recovers amounts previously written off.
Segment information
Operating segments are defined as components of an entity for which separate financial information is made available and is regularly evaluated by the chief operating decision maker (“CODM”) in making decisions regarding resource allocation and assessing performance. The Group’s CODM is its Chief Executive Officer (“CEO”), and operations are managed as a single segment for the purposes of assessing performance and making operating decisions. The CODM reviews the consolidated results when making decisions about allocating resources and assessing performance of the Group as a whole and hence, the Group has only one operating and reportable segment and no further analysis of this single segment is presented.
6.FOREIGN EXCHANGE GAINS AND LOSSES
|
|
|
|
|
|
|
|
|
|
|
For the six months ended June 30, |
|
|
|
2026 |
|
|
2025 |
|
(In thousands) |
|
|
|
|
|
|
Foreign exchange loss, net |
|
$ |
(42 |
) |
|
$ |
(77 |
) |
The Group primarily operates in the United States, People’s Republic of China (“PRC”), and Australia, with most of the transactions settled in the U.S. dollar. The Group’s presentation and functional currency is the U.S. dollar. Certain bank balances, deposits and other payables are denominated in Renminbi and Australian dollar, which exposes the Group to foreign currency risk. The Group incurs portions of its expenses in currencies other than the U.S. dollar, in particular, the Renminbi and Australian dollar. As a result, the Group is exposed to foreign currency exchange risk as its results of operations and cash flows are subject to fluctuations in foreign currency exchange rates.
The Group has not entered into any derivative contracts to hedge against its exposure to currency risk during the six months ended June 30, 2025 or 2026.
|
|
|
|
|
|
|
|
|
|
|
For the six months ended June 30, |
|
|
|
2026 |
|
|
2025 |
|
(In thousands) |
|
|
|
|
|
|
Loss for the period has been arrived at after charging: |
|
|
|
|
|
|
Staff costs: |
|
|
|
|
|
|
Salaries and other allowances |
|
$ |
930 |
|
|
$ |
1,320 |
|
Retirement benefits scheme contributions |
|
|
12 |
|
|
|
36 |
|
Share-based payment expenses |
|
|
1,017 |
|
|
|
3,274 |
|
Total staff costs |
|
|
1,959 |
|
|
|
4,630 |
|
Depreciation of plant and equipment |
|
|
3 |
|
|
|
18 |
|
Amortization of right-of-use assets |
|
|
91 |
|
|
|
115 |
|
Amortization of intangible assets |
|
|
— |
|
|
|
10 |
|
Impairment loss of intangible assets |
|
|
— |
|
|
|
1,500 |
|
Impairment loss on financial assets – expected credit loss |
|
|
2,300 |
|
|
|
— |
|
Other expenses |
|
|
— |
|
|
|
14 |
|
No dividend was declared or paid by the Group during the six months ended June 30, 2025 and 2026, nor has any dividend been proposed since June 30, 2026. The deemed distribution to a related party of $0.4 million recognized directly in equity in connection with the issuance of the Convertible Note (see Note 15) does not represent a dividend declared or paid.
APOLLOMICS INC.
Notes to Unaudited Condensed Consolidated Interim Financial Statements
The calculations of the basic and diluted loss per share are based on the following data:
|
|
|
|
|
|
|
|
|
|
|
For the six months ended June 30, |
|
|
|
2026 |
|
|
2025 |
|
(In thousands, except per share data) |
|
|
|
|
|
|
Loss: |
|
|
|
|
|
|
Loss for the period attributable to owners of the Company for the purpose of
calculating basic loss per share |
|
$ |
(8,774 |
) |
|
$ |
(12,536 |
) |
|
|
|
|
|
|
|
Number of shares: |
|
|
|
|
|
|
Weighted average number of Ordinary Shares for the purpose of calculating
basic and diluted loss per share |
|
|
2,174 |
|
|
|
1,103 |
|
|
|
|
|
|
|
|
Loss per Ordinary Shares Outstanding – Basic and Diluted |
|
$ |
(4.04 |
) |
|
$ |
(11.37 |
) |
The diluted loss per share for the six months ended June 30, 2025 and 2026 does not include the effect of the following instruments held as of June 30, 2025 and 2026 as their inclusion would be anti-dilutive:
|
|
|
|
|
|
|
|
|
|
|
As of June 30, |
|
(In thousands) |
|
2026 |
|
|
2025 |
|
Unvested restricted shares |
|
|
23 |
|
|
|
5 |
|
Share options |
|
|
37 |
|
|
|
256 |
|
Apollomics Private Warrants |
|
|
619 |
|
|
|
619 |
|
Apollomics Public Warrants |
|
|
10,350 |
|
|
|
10,350 |
|
Penny Warrants |
|
|
8 |
|
|
|
8 |
|
In addition to the instruments presented above, the Group has excluded from the computation of diluted loss per share the potential ordinary shares issuable upon conversion of the Convertible Note described in Note 15. Because the Convertible Note converts at a discount to the price of the Group’s next equity financing, which had not occurred and had not been priced as of June 30, 2026, the number of ordinary shares issuable upon conversion was not determinable as of that date and therefore has not been included in the table above. In any event, the potential dilutive effect of the Convertible Note would be anti-dilutive given the Group’s net loss position for the period. See Note 22 for discussion of the Convertible Note’s conversion subsequent to June 30, 2026.
Lease agreements are entered into for fixed lease terms of 12 to 60 months, without extension and termination options. Lease terms are negotiated on an individual basis and contain a wide range of different terms and conditions. In determining the lease term and assessing the length of the non-cancellable period, the Group applies the definition of a contract and determines the period for which the contract is enforceable. The Group recognized right-of-use assets of $0.7 million and lease liabilities of $0.7 million during the six months ended June 30, 2025, and recognized right-of-use assets of nil and lease liabilities of nil during the six months ended June 30, 2026. During the six months ended June 30, 2025, the Group derecognized right-of-use assets and lease liabilities totaling $0.1 million following the early termination of a lease. There were no such derecognitions during the six months ended June 30, 2026.
11.DEPOSITS, PREPAYMENTS AND DEFERRED EXPENSES
|
|
|
|
|
|
|
|
|
|
|
As of June 30, 2026 |
|
|
As of December 31, 2025 |
|
(In thousands) |
|
|
|
|
|
|
Prepayments |
|
$ |
400 |
|
|
$ |
285 |
|
Value-Added Tax recoverable |
|
|
42 |
|
|
|
185 |
|
Deposits |
|
|
193 |
|
|
|
- |
|
|
|
$ |
635 |
|
|
$ |
470 |
|
APOLLOMICS INC.
Notes to Unaudited Condensed Consolidated Interim Financial Statements
12.CASH AND CASH EQUIVALENTS
Bank balances earned interest at interest rates ranging from 4.0% to 4.2% per annum for the six months ended June 30, 2025 and from 3.4% to 3.6% per annum for the six months ended June 30, 2026.
Cash and cash equivalents presented on the unaudited condensed consolidated statements of financial position include:
(a) cash, which comprises of cash on hand and demand deposits; and
(b) cash equivalents, which comprises of short-term (generally with original maturity of three months or less), highly liquid investments that are readily convertible to a known amount of cash and which are subject to an insignificant risk of changes in value. Cash equivalents are held for the purpose of meeting short-term cash commitments rather than for investment or other purposes.
13.OTHER PAYABLES AND ACCRUALS
|
|
|
|
|
|
|
|
|
|
|
As of June 30, 2026 |
|
|
As of December 31, 2025 |
|
(In thousands) |
|
|
|
|
|
|
Payables in respect of research and development expenses |
|
$ |
2,169 |
|
|
$ |
1,786 |
|
Accrued salaries and bonuses |
|
|
50 |
|
|
|
28 |
|
Other payables and accruals (See Note 14) |
|
|
6,477 |
|
|
|
4,303 |
|
|
|
$ |
8,696 |
|
|
$ |
6,117 |
|
14.OTHER NON-CURRENT LIABILITIES
On November 19, 2025, the Group entered into a settlement agreement to fully resolve and conclude all matters related to legal proceedings previously filed in the Grand Court of the Cayman Islands by two minority investors. Under the terms of the agreement, the Group agreed to pay $5.0 million in cash and approximately $0.9 million in associated legal expenses.
As of June 30, 2026, $4.0 million of the settlement obligation remains unpaid. Based on the payment due dates, $2.5 million of the settlement obligation is included in other payables and accruals (See Note 13), with the remaining $1.5 million classified as other non-current liabilities in the statement of financial position.
15. CONVERTIBLE NOTE, RELATED PARTY AND DERIVATIVE LIABILITY
On March 30, 2026, the Company issued an unsecured convertible promissory note (the “Convertible Note”) in the principal amount of $2.0 million to the Company’s Chairman and Chief Executive Officer. The Convertible Note bears no interest (0% per annum) and, unless earlier converted, was to mature on September 30, 2027 (eighteen months from issuance). See Note 20 for further related party disclosures regarding this transaction.
The outstanding principal balance of the Convertible Note automatically would convert into equity securities upon the closing of the Company’s next equity financing that generates aggregate gross proceeds of at least $10.0 million (an “Equity Financing Conversion”), at a conversion price equal to 80% of the lowest per share purchase price of the equity securities issued in that financing. The Convertible Note also provided for conversion upon a qualifying corporate transaction, or at the Holder’s election on or after the maturity date, in each case using an alternative conversion price formula specific to that scenario.
The Convertible Note is presented within current liabilities, as its earliest possible conversion or repayment date falls within twelve months of the balance sheet date. Management has concluded, based on a formal analysis under IAS 32 and IFRS 9, that the Convertible Note is a financial liability in its entirety. None of the three conversion features described above satisfies the “fixed-for-fixed” condition in IAS 32, as each conversion price is variable and market-referential. Accordingly, no equity component is recognized, and compound instrument split accounting under IAS 32 is not available.
Management has further concluded that each of the three conversion features is an embedded derivative that is not closely related to the host debt contract and, because the Convertible Note has not been designated at fair value through profit or loss in its entirety, each must be bifurcated from the host liability and accounted for separately under IFRS 9. Because the three conversion features are mutually exclusive, they are accounted for together as a single compound embedded derivative. Under this approach, the derivative liability is recognized at fair value, determined under IFRS 13 using an income approach (a probability-weighted scenario analysis classified within Level 3 of the fair value hierarchy; see Note 18), with subsequent changes in fair value recognized in profit or loss at each reporting date. The host liability is recognized at its fair value at the
APOLLOMICS INC.
Notes to Unaudited Condensed Consolidated Interim Financial Statements
issue date and is subsequently measured at amortized cost using the effective interest method, accreting to the $2.0 million principal amount over the contractual term to September 30, 2027.
The fair value of the Convertible Note at initial recognition on March 30, 2026 was $2.4 million, comprising the Derivative Liability of $0.8 million and the host liability of $1.6 million, being the present value of the $2.0 million principal amount discounted at a credit-adjusted market rate of 15.79%. Because the Holder is a related party, the $0.4 million excess of the fair value of the Convertible Note over the $2.0 million proceeds was accounted for separately under IFRS 9 as a deemed distribution to the Holder in his capacity as a shareholder and was recognized directly in equity (other reserve); see Note 20. The host liability is accreted to the $2.0 million principal amount at an effective interest rate of 16.2% per annum, which includes the effect of issuance costs. The movements in the carrying amounts of the host liability and the Derivative Liability from the issue date to June 30, 2026 were as follows:
|
|
|
|
|
|
|
|
|
|
|
|
|
|
|
Host liability (amortized cost) |
|
|
Derivative Liability (FVTPL) |
|
|
Total |
|
(In thousands) |
|
|
|
|
|
|
|
|
|
Proceeds allocated on issuance, March 30, 2026 |
|
$ |
1,229 |
|
|
$ |
771 |
|
|
$ |
2,000 |
|
Excess of fair value over proceeds – deemed distribution (Note 20) |
|
|
376 |
|
|
— |
|
|
|
376 |
|
Issuance costs |
|
|
(9 |
) |
|
— |
|
|
|
(9 |
) |
Interest expense |
|
|
62 |
|
|
— |
|
|
|
62 |
|
Change in fair value recognized in profit or loss |
|
— |
|
|
|
(39 |
) |
|
|
(39 |
) |
As of June 30, 2026 |
|
$ |
1,658 |
|
|
$ |
732 |
|
|
$ |
2,390 |
|
Issuance costs of $9 thousand that were directly attributable to the issuance of the Convertible Note were deducted from the initial carrying amount of the host liability and are recognized in interest expense over the term of the Convertible Note using the effective interest method. As of June 30, 2026, the carrying amount of the host liability of $1.7 million presented in the unaudited condensed consolidated interim statements of financial position is net of $7 thousand of unamortized transaction costs.
Interest expense on the host liability of $0.1 million is included in finance costs, and the gain of $39 thousand from the change in fair value of the Derivative Liability is included in fair value change of financial liabilities at FVTPL, in the unaudited condensed consolidated interim statements of operations and comprehensive loss. Both are non-cash items and are presented as adjustments in reconciling loss before taxation to net cash used in operating activities; the net proceeds from issuance of the Convertible Note are presented within financing activities in the unaudited condensed consolidated interim statements of cash flows; the excess of the fair value of the Convertible Note over the proceeds is a non-cash transaction and is disclosed as a non-cash financing activity. The Derivative Liability is classified within Level 3 of the fair value hierarchy; its valuation technique, significant unobservable inputs and the sensitivity of its fair value to changes in those inputs are disclosed in Note 18.
Subsequent to June 30, 2026, the Convertible Note converted in full in connection with the Company’s Private Placement. See Note 22.
Share capital
The share capital as of June 30, 2025, December 31, 2025, and June 30, 2026 represented the issued ordinary share capital of the Group.
APOLLOMICS INC.
Notes to Unaudited Condensed Consolidated Interim Financial Statements
|
|
|
|
|
|
|
|
|
|
|
|
|
(In thousands, except share and per share data) |
|
NOTES |
|
Number of
shares |
|
|
|
|
Amount |
|
Authorized: |
|
|
|
|
|
|
|
|
|
|
As of June 30, 2025, December 31, 2025, and June 30, 2026 |
|
(i) |
|
|
130,000,000 |
|
|
|
|
$ |
1,300 |
|
|
|
|
|
|
|
|
|
|
|
|
Issued and fully paid: |
|
|
|
|
|
|
|
|
|
|
As of January 1, 2025 |
|
|
|
|
1,102,792 |
|
|
|
|
$ |
11 |
|
Class A Ordinary Shares issued to board members for board fees |
|
|
|
|
556 |
|
|
|
|
— |
|
As of June 30, 2025 |
|
|
|
|
1,103,348 |
|
|
|
|
$ |
11 |
|
|
|
|
|
|
|
|
|
|
|
|
As of January 1, 2026 |
|
|
|
|
2,147,105 |
|
|
|
|
|
21 |
|
Shares issued to employees for compensation |
|
|
|
|
48,730 |
|
|
|
|
|
1 |
|
Shares issued to board members for board fees |
|
|
|
|
7,138 |
|
|
|
|
— |
|
Shares issued on exercise of share options |
|
|
|
|
11,991 |
|
|
|
|
— |
|
As of June 30, 2026 |
|
|
|
|
2,214,964 |
|
|
|
|
$ |
22 |
|
Note i: Pursuant to Apollomics’ sixth amended and restated memorandum and articles of association, as amended as a result of the Apollomics’ 2024 Extraordinary General Meeting of Shareholders, the authorized share capital of Apollomics increased to 130,000,000 shares, comprised of 100,000,000 Class A Ordinary Shares, and 20,000,000 Class B Ordinary Shares, and 10,000,000 preference shares, par value $0.01 per share.
All the Ordinary Shares issued during the six months ended June 30, 2025 and 2026 rank pari passu with the existing shares in all respects.
On July 19, 2016, the shareholders of the Group approved the adoption of the 2016 equity incentive plan (the “2016 Plan”) for the purpose of securing and retaining employees, directors and consultants of the Group, providing incentives for them to exert maximum efforts for the success of the Group and any affiliate, and providing means by which such persons may benefit from increases in value of the ordinary shares of the Group.
The 2016 Plan provided for the grant of the following types of share awards: (i) restricted share awards, (ii) share options, (iii) share appreciation rights, (iv) restricted share unit awards, and (v) other share awards.
In March 2023, in connection with the consummation of the business combination with Maxpro Capital Acquisition Corp., the Board terminated the 2016 Plan and adopted the Apollomics Inc. 2023 Incentive Award Plan (the “Incentive Plan”), and 8,679,583 Class A Ordinary Shares have been reserved for issuance. The Incentive Plan allows the Group to make equity and equity-based incentive awards to officers, employees, non-employee directors and the Group’s consultants and affiliates (the “Eligible Persons”). The Group expects to use equity-based awards to promote the Group’s interest by providing Eligible Persons with the opportunity to acquire equity interests as an incentive for their remaining in the Group’s service and aligning their interests with those of the Group’s equity holders. The Group’s Board anticipates that providing such persons with a direct stake in the Group will assure a closer alignment of the interests of such individuals with the Group’s interests and the interests of its shareholders, thereby stimulating their efforts on the Group’s behalf and strengthening their desire to remain with the Group and its affiliates.
During the six months ended June 30, 2025 and 2026, the Group had issued restricted share awards and share options to Eligible Persons and no share appreciation rights, restricted share unit awards or other share awards were granted under either the 2016 Plan or the Incentive Plan by the Group.
Restricted share and restricted share unit awards
Under guidance for share-based compensation, the fair value of the Group’s restricted share and restricted share unit (RSU) awards is based on the grant date fair value of the Group’s Class A Ordinary Shares. During the six months ended June 30, 2025, the Group issued restricted shares, all of which were granted with no purchase price. During the six months ended June 30, 2026, the Group issued RSUs, all of which also were granted with no purchase price. The weighted-average grant date fair value of the restricted share awards and RSU awards, as applicable, was $6.20 and $19.00 during the six months ended June 30, 2025 and 2026, respectively.
APOLLOMICS INC.
Notes to Unaudited Condensed Consolidated Interim Financial Statements
The total expense recognized in the unaudited condensed consolidated interim statements of operations and comprehensive loss for the restricted shares and RSUs granted, as applicable, was $100 thousand and $1,037 thousand, for the six months ended June 30, 2025 and 2026, respectively.
The following table summarizes the Group’s stock movement during the six months ended June 30, 2025 and 2026 as a result of restricted share and RSU awards:
|
|
|
|
|
|
|
|
|
|
|
2026 |
|
|
2025 |
|
|
|
Number of unvested awards |
|
|
Number of unvested awards |
|
Outstanding as of January 1, |
|
|
1,536 |
|
|
|
1,108 |
|
Awarded |
|
|
90,000 |
|
|
|
4,194 |
|
Vested |
|
|
(68,536 |
) |
|
|
(556 |
) |
Outstanding as of June 30, |
|
|
23,000 |
|
|
|
4,746 |
|
RSUs granted during the six months ended June 30, 2026 have a remaining weighted average vesting term of approximately 0.26 years. The vesting terms for these awards ranged from vesting immediately to a vesting term of one year.
Share options
The following table discloses movements of the Group’s share options held by grantees during the six months ended June 30, 2025 and 2026:
|
|
|
|
|
|
|
|
|
|
|
|
|
|
|
|
|
|
|
2026 |
|
|
2025 |
|
|
|
Number of Share |
|
|
Weighted-average |
|
|
Number of Share |
|
|
Weighted-average |
|
|
|
Options |
|
|
exercise price |
|
|
Options |
|
|
exercise price |
|
Outstanding at January 1, |
|
|
92,072 |
|
|
$ |
293.544 |
|
|
|
194,594 |
|
|
$ |
288.160 |
|
Granted |
|
— |
|
|
— |
|
|
|
64,768 |
|
|
|
6.114 |
|
Exercised |
|
|
(11,991 |
) |
|
|
14.000 |
|
|
— |
|
|
— |
|
Forfeited |
|
|
(1,887 |
) |
|
|
249.330 |
|
|
|
(1,666 |
) |
|
|
301.822 |
|
Expired |
|
|
(40,941 |
) |
|
|
317.129 |
|
|
|
(1,208 |
) |
|
|
355.108 |
|
Outstanding at June 30, |
|
|
37,253 |
|
|
$ |
359.844 |
|
|
|
256,488 |
|
|
$ |
216.534 |
|
Exercisable at the end of the period |
|
|
31,905 |
|
|
|
|
|
|
148,009 |
|
|
|
|
No share options granted in the above table will be exercisable after the expiration of 10 years from the date of its grant.
The share options outstanding as of June 30, 2025 and 2026 had a weighted average remaining contractual life of 3.82 years and 1.81 years, respectively. No share options were granted during the six months ended June 30, 2026. During the six months ended June 30, 2025, the weighted average fair value of the share options granted was $5.0519 per share.
The time-based share options vest ratably on a monthly basis over a 24-month to 48-month vesting period or with 25% or 50% vesting on the first anniversary of the vesting inception date and the remaining portion vesting ratably on a monthly basis over a 12-month to 36-month vesting period. The milestone-based share options vest upon achievement of specified performance conditions. The expected vesting period is estimated by the management of the Group based on the most likely outcome of each of the performance conditions.
The Option Pricing Model (“OPM”) was used to determine the fair value of the option granted. The key inputs for the share options granted during the periods were as follows:
|
|
|
|
|
|
|
|
|
For the six months ended June 30, |
|
|
|
2026 |
|
2025 |
|
Grant date option fair value per share |
|
N/A |
|
$4.7700 -
$5.4397 |
|
Exercise price |
|
N/A |
|
$6.09 -
$6.20 |
|
Expected volatility (note i) |
|
N/A |
|
94.48% -
126.88% |
|
Expected life |
|
N/A |
|
5.50 -
6.02 years |
|
Risk-free rate |
|
N/A |
|
3.99% -
4% |
|
Expected dividend yield |
|
N/A |
|
|
0 |
% |
APOLLOMICS INC.
Notes to Unaudited Condensed Consolidated Interim Financial Statements
Note i: The expected volatility measured at the standard deviation is based on the historical data of the daily share price movement of comparable companies.
The total expense recognized in the unaudited condensed consolidated interim statements of operations and comprehensive loss for share options granted was $3,174 thousand and ($20) thousand for the six months ended June 30, 2025 and 2026, respectively.
18.FAIR VALUE MEASUREMENTS OF FINANCIAL INSTRUMENTS
(i)Fair value of the Group’s financial assets and financial liabilities that are measured at fair value on a recurring basis
Some of the Group’s financial assets and financial liabilities are measured at fair value at the end of each reporting period. The following table gives information about how the fair values of these financial assets and financial liabilities are determined (in particular, the valuation techniques and inputs used).
|
|
|
|
|
|
|
|
|
|
|
|
|
|
|
|
|
|
|
Fair value as of |
|
|
|
|
|
|
|
|
|
(In thousands) |
|
June 30, 2026 |
|
|
December 31, 2025 |
|
|
Fair
value
hierarchy |
|
Valuation technique(s)
and key inputs |
|
Significant
unobservable inputs |
|
Relationship of
unobservable inputs
to fair value |
Financial liabilities |
|
|
|
|
|
|
|
|
|
|
|
|
|
|
Maxpro public
warrants assumed
by Apollomics |
|
208 |
|
|
|
115 |
|
|
Level 1 |
|
The public warrants are traded on the Nasdaq, the valuation is based on unadjusted quoted prices in active markets for identical assets or liabilities |
|
N/A |
|
N/A |
Maxpro private
warrants assumed
by Apollomics, and
Private warrants
issued in
connection with the
conversion of the
promissory note
payable to the
Maxpro Sponsor |
|
12 |
|
|
|
7 |
|
|
Level 2 |
|
Private warrants are considered to be economically equivalent to the public warrants. As such, the valuation of the public warrants was used to value the private warrants |
|
N/A |
|
N/A |
Penny warrants |
|
2 |
|
|
|
2 |
|
|
Level 3 |
|
Black-Scholes model - the key inputs are: underlying share price, expected life in years, risk-free rate, expected volatility, and exercise price |
|
N/A |
|
N/A |
Total warrant liabilities: |
|
$ |
222 |
|
|
$ |
124 |
|
|
|
|
|
|
|
|
|
Derivative liability, related party (Note 15) |
|
732 |
|
|
— |
|
|
Level 3 |
|
Probability-weighted scenario analysis (see below) |
|
Probability of conversion; expected financing date; credit-adjusted discount rate (see below) |
|
See below |
Total financial liabilities at FVTPL: |
|
$ |
954 |
|
|
$ |
124 |
|
|
|
|
|
|
|
|
|
Level 3 fair value measurement – Derivative Liability
The following table presents the changes in the derivative liability (Note 15), which is classified within Level 3 of the fair value hierarchy, for the six months ended June 30, 2026:
APOLLOMICS INC.
Notes to Unaudited Condensed Consolidated Interim Financial Statements
|
|
|
|
|
(In thousands) |
|
Derivative Liability |
|
As of January 1, 2026 |
|
$ |
— |
|
Recognized on issuance of the Convertible Note, March 30, 2026 |
|
|
771 |
|
Change in fair value recognized in profit or loss (1) |
|
|
(39 |
) |
As of June 30, 2026 |
|
$ |
732 |
|
(1) The change in fair value is unrealized, relates to the Derivative Liability held as of June 30, 2026, and is included in fair value change of financial liabilities at FVTPL in the unaudited condensed consolidated interim statements of operations and comprehensive loss.
There were no transfers between levels of the fair value hierarchy during the six months ended June 30, 2025 and 2026.
The fair value of the Derivative Liability is determined by management with the assistance of an independent valuer. The fair value of the Convertible Note in its entirety is determined as the probability-weighted present value of the payoffs under two scenarios: (i) automatic conversion upon the next equity financing at a conversion price equal to 80% of the price paid by investors in that financing, discounted at the risk-free interest rate; and (ii) repayment of the principal amount at maturity, discounted at a credit-adjusted discount rate. The fair value of the Derivative Liability is the difference between the fair value of the Convertible Note in its entirety and the value of the Convertible Note without its conversion features. The key inputs used in the valuation were as follows:
|
|
|
|
|
|
|
|
|
|
|
|
|
|
|
|
|
|
March 30, 2026 |
|
|
June 30, 2026 |
|
Probability of conversion upon the next equity financing |
|
|
90 |
% |
|
|
90 |
% |
Expected date of the next equity financing |
|
August 31, 2026 |
|
|
August 31, 2026 |
|
Risk-free interest rate |
|
|
3.65 |
% |
|
|
3.85 |
% |
Credit-adjusted discount rate |
|
|
15.79 |
% |
|
|
15.49 |
% |
The credit-adjusted discount rate reflects the yield on CCC-rated corporate bonds plus a company-specific risk premium. An increase in the probability of conversion or in the credit-adjusted discount rate, or an earlier expected date of the next equity financing, would increase the fair value of the Derivative Liability, and vice versa. The following table shows the effect on the fair value of the Derivative Liability as of June 30, 2026 of reasonably possible changes in the significant unobservable inputs, holding the other inputs constant:
|
|
|
(In thousands) |
|
Fair value of Derivative Liability |
As reported |
|
732 |
Probability of conversion decreased by 10 percentage points |
|
651 |
Probability of conversion increased by 10 percentage points |
|
814 |
Expected date of the next equity financing three months later |
|
711 |
Credit-adjusted discount rate decreased by 1 percentage point |
|
716 |
Credit-adjusted discount rate increased by 1 percentage point |
|
749 |
(ii)Fair value of financial liabilities that are not measured at fair value
Except for the host liability of the Convertible Note, the management of the Group consider that the carrying amount of the Group’s financial liabilities recorded at amortized cost in the unaudited condensed consolidated interim financial statements approximate their fair values. Such fair values have been deemed in accordance with generally accepted pricing models based on a discounted cash flow analysis.
As of June 30, 2026, the host liability of the Convertible Note (Note 15) had a carrying amount of $1,658 thousand and a fair value of $1,670 thousand. Its fair value is classified within Level 3 of the fair value hierarchy and was determined by discounting the $2.0 million principal amount payable at maturity at the credit-adjusted discount rate of 15.49%.
19.RETIREMENT BENEFITS PLAN
The employees employed by the Zhejiang Crownmab Biotech Co. Ltd, PRC subsidiary are members of the state-managed retirement benefits scheme operated by the PRC government. The PRC subsidiary is required to contribute a certain percentage
APOLLOMICS INC.
Notes to Unaudited Condensed Consolidated Interim Financial Statements
of their payroll to the retirement benefits scheme to fund the benefits. The only obligation of the Group with respect to the retirement benefits scheme is to make the required contributions under the scheme.
The employees employed by Apollomics Inc. (Taiwan) Limited subsidiary are members of the state-managed retirement benefits scheme operated by the Taiwan government (Bureau of Labor Insurance). The Taiwan subsidiary is required to contribute a certain percentage of their payroll to the retirement benefits schedule to fund the benefits. The only obligation of the Group with respect to the retirement benefits scheme is to make the required contributions under the scheme.
The Group maintains multiple qualified contributory saving plans as allowed under Section 401(k) of the Internal Revenue Code in the United States. These plans are defined contribution plans covering employees employed in the United States and provide for voluntary contributions by employees, subject to certain limits. The contributions are made by both the employees and the employer. The employees’ contributions are primarily based on specified dollar amounts or percentages of employee compensation.
The total cost charged to profit or loss of $36 thousand and $30 thousand, respectively represents contributions paid or payable to the above schemes by the Group for the six months ended June 30, 2025 and 2026.
At the end of each reporting period, there were no forfeited contributions which arose upon employees leaving the schemes prior to their interests in the Group’s contribution becoming fully vested and which are available to reduce the contributions payable by the Group in future years.
20.RELATED PARTY DISCLOSURES
Compensation of key management personnel
The remuneration of directors of the Group and key management were as follows:
|
|
|
|
|
|
|
|
|
|
|
For the six months ended June 30, |
|
|
|
2026 |
|
|
2025 |
|
(In thousands) |
|
|
|
|
|
|
Short term benefits |
|
$ |
504 |
|
|
$ |
987 |
|
Retirement benefit scheme contributions |
|
|
3 |
|
|
|
8 |
|
Share-based payment |
|
|
1,271 |
|
|
|
1,029 |
|
|
|
$ |
1,778 |
|
|
$ |
2,024 |
|
The remuneration of key management personnel is determined by the directors of the Group having regard to the performance of individuals and market trends.
On March 30, 2026, the Group issued a $2.0 million unsecured convertible promissory note to the Company’s Chairman and Chief Executive Officer, who is a related party of the Group. The note bears no interest, is unsecured, and converts into equity securities upon the terms described in Note 15. The fair value of the Convertible Note at issuance exceeded the $2.0 million proceeds by $0.4 million; this excess was accounted for as a deemed distribution to the Chairman and Chief Executive Officer in his capacity as a shareholder and was recognized in equity (other reserve) (see Note 15). Other than the remuneration disclosed above and the Convertible Note, the Group did not enter into any other material related party transactions during the six months ended June 30, 2025 or 2026.
The Group’s ability to pay dividends may depend on the Group receiving distributions of funds from its subsidiaries. The Group’s PRC subsidiaries are subject to relevant PRC statutory laws and regulations which permit payments of dividends only out of retained earnings, if any, as determined in accordance with PRC accounting standards and regulations. In the event of such dividends being declared, there would be PRC withholding tax on such dividends. The results of operations reflected in the unaudited condensed consolidated interim financial statements prepared in accordance with IAS 34 differ from those reflected in the statutory financial statements of the Group’s PRC subsidiaries. Foreign exchange and other regulations in the PRC further restrict the Group’s PRC subsidiaries from transferring funds to the Group in the form of dividends, loans and advances. As of December 31, 2025 and June 30, 2026, amounts restricted are the paid-in capital of the Group’s PRC subsidiaries, which amounted to $35.0 million and $35.0 million, respectively.
APOLLOMICS INC.
Notes to Unaudited Condensed Consolidated Interim Financial Statements
The Group has evaluated subsequent events and transactions that occurred after June 30, 2026 and up through November 6, 2026, which is the date when the unaudited condensed consolidated interim financial statements were available to be issued.
On August 7, 2026, the Company entered into definitive subscription agreements with certain accredited investors for a private placement transaction (the "Private Placement") for aggregate gross consideration of approximately $10.0 million, comprising (i) cash subscriptions for 533,334 Class A ordinary shares at a purchase price of $15.00 per share, generating gross proceeds of approximately $8.0 million, and (ii) the automatic conversion of the $2.0 million outstanding principal amount of the Convertible Note (see Note 15) into 166,667 Class A ordinary shares at a conversion price of $12.00 per share, representing 80% of the cash investors' purchase price. The Private Placement closed on August 14, 2026, resulting in the issuance of an aggregate of 700,001 Class A ordinary shares and the extinguishment of the Convertible Note.
On September 14, 2026, the Board of Directors and Compensation Committee approved executive and director compensation for September 15, 2026 through September 14, 2027. It provides (i) annual base salaries of $200,000 for each of the Chief Executive Officer, Chief Operating Officer and Chief Financial Officer, plus performance bonuses of up to $400,000 each, earned only if capital-raising, market capitalization and operational milestones are met by dates through September 30, 2027; and (ii) 52,000 stock options (12,000 for the six members of the Board and 40,000 for 17 employees, including 6,000 for each of the three executives), vesting 50% after six months and 50% after twelve months. The Group will recognize the related expense over the service and vesting periods from the third quarter of 2026 and has not yet estimated the amount.
Other than the events disclosed above and elsewhere in these unaudited condensed consolidated interim financial statements, there is no other subsequent event occurred that would require recognition or disclosure in the Group’s unaudited condensed consolidated interim financial statements.
EX-99.2
Exhibit 99.2
MANAGEMENT’S DISCUSSION AND ANALYSIS OF FINANCIAL CONDITION AND RESULTS OF OPERATIONS
The following discussion and analysis of our financial condition and results of operations (the “MD&A”) should be read together with the unaudited condensed consolidated interim financial statements and the related notes to those statements included as Exhibit 99.1 to this Report on Form 6-K submitted to the Securities and Exchange Commission, or the SEC, on November 6, 2026. We also recommend that you read our discussion and analysis of financial condition and results of operations together with our audited financial statements and the notes thereto, which appear in our Annual Report on Form 20-F for the year ended December 31, 2025 as filed with the SEC on April 24, 2026 (the “Annual Report”).
In this section, unless otherwise indicated or the context otherwise requires, the terms “we,” “our,” “us,” “Apollomics,” “Apollomics’,” the “Company,” and “its” refer to Apollomics and its consolidated subsidiaries. All dollar amounts are expressed in thousands of United States dollars (“$”), unless otherwise indicated.
The following discussion contains forward-looking statements within the meaning of the federal securities laws, including Section 27A of the Securities Act of 1933, as amended (the “Securities Act”), and Section 21E of the Securities Exchange Act of 1934, as amended (the “Exchange Act”). Such forward-looking statements regarding the Company’s strategy, prospects, plans and objectives often contain words and phrases such as “could,” “should,” “will,” “may,” “believe,” “anticipate,” “intend,” “estimate,” “expect,” “project,” the negative of such terms and other similar expressions, although not all forward-looking statements contain such expressions. These forward-looking statements are based on management’s current expectations and assumptions about future events and are based on currently available information as to the outcome and timing of future events. Apollomics cautions you that these forward-looking statements are subject to numerous risks and uncertainties, most of which are difficult to predict and many of which are beyond the control of Apollomics. In addition, Apollomics cautions you that the forward-looking statements contained in this MD&A are subject to unknown risks, uncertainties and other factors, including: (i) the impact of any current or new government regulations in the United States and China affecting Apollomics’ operations and the continued listing of Apollomics’ securities; (ii) the inability to achieve successful clinical results or to obtain licensing of third-party intellectual property rights for future discovery and development of Apollomics’ oncology projects; (iii) the failure to commercialize product candidates and achieve market acceptance of such product candidates; (iv) the failure to protect Apollomics’ intellectual property; (v) breaches in data security; (vi) the risk that Apollomics may not be able to develop and maintain effective internal controls; (vii) unfavorable changes to the regulatory environment; and (viii) those risks and uncertainties discussed in the Annual Report on Form 20-F for the year ended December 31, 2025 (our “Annual Report”), filed by Apollomics Inc. with the U.S. Securities and Exchange Commission (“SEC”) under the heading “Risk Factors” and the other documents filed, or to be filed, by the Company with the SEC. Apollomics’ historical results are not necessarily indicative of the results that may be expected for any period in the future. Forward-looking statements speak only as of the date made by the Company. Apollomics undertakes no obligation to update publicly any of its forward-looking statements to reflect actual results, new information or future events, changes in assumptions or changes in other factors affecting forward-looking statements, except to the extent required by applicable law.
Overview
We are a clinical-stage biotechnology company focused on discovering and developing oncology therapies to address unmet medical needs, especially for difficult-to-treat and treatment-resistant cancers. Since our founding in 2015, we have built an oncology-focused pipeline, including product candidates that have progressed into clinical-stage development. Our lead program, vebreltinib, has demonstrated initial promising clinical results.
We were originally formed as CB Therapeutics Inc. as a result of a spin-off of Crown Bioscience International, which was completed on December 31, 2015. As a result, we became the owner of certain patent and intellectual property rights relating to some of our product candidates. For more information relating to the series of transactions resulting in our acquisition of these patent rights, please see the section of our Annual Report entitled “Intellectual Property Assignment.”
Our strategic focus is the development of novel therapies targeting difficult to treat cancers. We use both targeted, immuno-oncology, and other innovative approaches to address a range of cancer indications, such as lung cancer, brain cancer, and other solid tumors. Our pipeline includes a variety of cancer treatment programs that utilize tumor inhibitors, immune checkpoint inhibitors, monotherapies, combination therapies or a multi-functional protein with the goals to improve response rates and reduce chemo-resistance and toxicity compared to the current treatment standards. We have adopted a biomarker-driven diagnostic approach for patient screening to increase precision in identifying patients that can potentially benefit from target therapy.
Recent Events
Trading Markets Update
The Company’s Class A Ordinary Shares and warrants are listed on Nasdaq under the trading symbols “APLM” and “APLMW,” respectively.
In March 2025, we entered into an agreement with LaunXP International Co., Ltd. for development and commercialization of vebreltinib in specified Asian territories. The agreement provided for $10.0 million in upfront consideration, of which $8.5 million was allocated to the license and recognized as revenue in the six months ended June 30, 2025, and $1.5 million was allocated to initial clinical drug supply. No licensing revenue was recognized in the six months ended June 30, 2026. LaunXP failed to remit the remaining upfront payment balance; we terminated the agreement effective June 11, 2026, and initiated the contractually prescribed dispute-resolution process on June 18, 2026. LaunXP has disputed the termination. We recognized a $2.3 million expected credit loss in the first half of 2026, fully reserving the outstanding receivable as of June 30, 2026. We continue to seek recovery, but no recovery is assured. See Note 5 to the interim financial statements.
On March 30, 2026, our Chairman and Chief Executive Officer advanced $2.0 million under an unsecured, non-interest-bearing convertible promissory note. In August 2026, we completed a private placement consisting of approximately $8.0 million in new cash subscriptions for 533,334 Class A Ordinary Shares at $15.00 per share and automatic conversion of the $2.0 million note principal into 166,667 shares at $12.00 per share. The private placement closed on August 14, 2026, resulting in the issuance of 700,001 shares and extinguishment of the convertible note. Because the private placement closed after June 30, 2026, its proceeds are not included in June 30, 2026 cash. See Note 22 to the interim financial statements.
On June 18, 2026, the Company received a written notice from the Listing Qualifications Department of Nasdaq stating that the Company was not in compliance with the minimum Market Value of Listed Securities (“MVLS”) of $35 million required for continued listing on The Nasdaq Capital Market under Nasdaq Listing Rule 5550(b)(2), and that the Company also did not meet the alternative requirements under Nasdaq Listing Rules 5550(b)(1) and 5550(b)(3). Pursuant to Nasdaq Listing Rule 5810(c)(3)(C), the Company was provided a compliance period of 180 calendar days, or until December 15, 2026, to regain compliance. The notice had no immediate effect on the listing of the Company’s securities. On July 8, 2026, the Company received written notice from Nasdaq confirming that, based on the Company’s MVLS for the 10 consecutive business days from June 23, 2026 to July 7, 2026, the Company had regained compliance with the MVLS requirement, and the matter was closed.
Our Product Candidates
The product candidates in our pipeline can be categorized into two groups based on their mechanisms of action, each of which contains product candidates at different stages of development: (i) tumor inhibitors and (ii) immuno-oncology drugs. We believe that having two groups of product candidates with different mechanisms of action will enable us to develop potential synergistic therapies that address unmet needs in cancer treatment.
Active Development Programs: Tumor Inhibitors
Vebreltinib (APL-101). Our most advanced product candidate is vebreltinib, a potent, oral active, highly selective c-Met inhibitor. Cancer cells often use c-Met activation to escape therapies targeting other signaling pathways. Capmatinib and tepotinib, two c-Met inhibitors, were approved by the FDA for the treatment of metastatic NSCLC with Met Exon 14 skipping in 2020 and 2021 under accelerated approval, respectively, followed by traditional approvals in 2022 and 2024, rendering Met Exon 14 skipping a clinically validated target. Avistone, our partner in China, received conditional approval from the NMPA for vebreltinib in November 2023 for the same indication. In addition, in April 2024, Avistone received conditional approval from the NMPA for vebreltinib for the treatment of gliomas with a PTPRZ1-MET fusion (ZM fusion) gene after failure of previous treatments. We believe that the potential of vebreltinib in cancers with genetic mutations, amplification or fusion of the c-Met gene presents a significant opportunity for us. We are investigating vebreltinib in clinical trials as a single agent for the potential treatment of NSCLC and other advanced tumors with c-Met alterations, and also as a combination therapy with epidermal growth factor receptor (“EGFR”) inhibitors. We have obtained orphan drug designation for vebreltinib for the “treatment of non-small cell lung cancer with MET genomic tumor aberrations,” which includes Met Exon 14 skipping and c-Met amplification. Our primary focus for the future development of vebreltinib will be for the
treatment of NSCLC with c-Met Amplification. We intend to continue to explore the opportunity for combining vebreltinib with other approved drugs or product candidates.
APL-102. APL-102 is an oral active, small molecule Multiple Tyrosine Kinase Inhibitor (“MTKi”). Data regarding anti-tumor activity in multiple preclinical studies is included in the section of this Annual Report entitled “Our Other Tumor Inhibitor Programs—APL-102 (MTKi)”, such as models of liver cancer, breast cancer and esophageal cancer, both as a single agent and in combination with an anti-PD-1 antibody. Given that APL-102 inhibits several kinases that are aberrantly activated in cancer cells, we believe that APL-102 has the potential to overcome cancer treatment resistance. APL-102 is in a Phase 1 dose escalation clinical trial in China and is at the seventh dose level. As of the date of this Annual Report, dose-limiting toxicity has not been observed in human subjects.
Other Development Programs: Immuno-Oncology Product Candidates
Our three immuno-oncology product candidates consist of: APL-501, APL-502 and APL-801. These product candidates are designed to take advantage of the body’s immune system to fight cancer and include mono-specific and bi-specific antibodies that could release the natural brakes of immune response against cancer cells, as well as a novel cancer vaccine. Our current strategy is to identify development and commercialization partners for these product candidates to enable the most capital-efficient development programs in this highly competitive area.
APL-501. APL-501 is an anti-PD-1 antibody product candidate. Data from a Phase 1 study in advanced or relapsed/refractory solid tumors in Australia are currently being analyzed.
APL-502. APL-502 is an anti-PD-L1 antibody product candidate and is being developed by Chia Tai Tian Qing (“CTTQ”), our partner in China. APL-502 (also known as TQB-2450) has been approved by China’s NMPA for three distinct indications: extensive-stage small cell lung cancer, recurrent/metastatic endometrial cancer, and late-stage unresectable or metastatic renal cell carcinoma. Ongoing clinical trials include the following tumor types: NSCLC, esophageal cancer, ovarian cancer, hepatocellular carcinoma, cholangiocarcinoma, primary mediastinal large B cell lymphoma, and alveolar soft part sarcoma.
Having our own anti-PD-1 and anti-PD-L1 antibody candidates allows us to develop single-agent and combination therapies based on PD-(L)1 inhibition and also enables us to, using these antibodies as backbones, design and generate novel molecules, such as multi-specific antibodies, which may have improved activity compared with currently marketed immune checkpoint inhibitor products.
Our pipeline also includes an anti-PD-L1/anti-CD40 bi-specific antibody, APL-801.
Product Candidate Development Status
The following chart summarizes the development status of our product candidates from clinical stage to discovery stage. Third parties also have ongoing clinical trials in their respective territories.
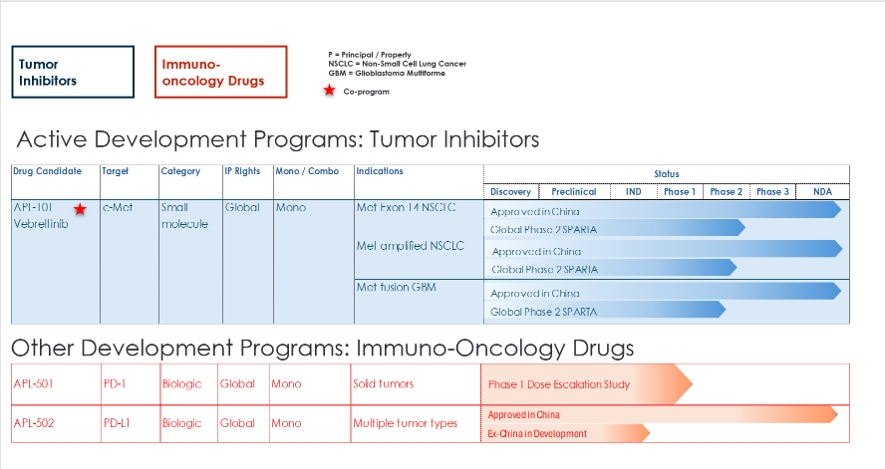
Key highlights of clinical trials conducted by third parties on our product candidates include:
•Avistone has conducted clinical trials for vebreltinib in China through the completion of Phase 2 in NSCLC with c-Met alterations, and has completed a randomized Phase 2/3 trial in GBM patients with PTPRZ1 c-Met fusion; those are approved in China
•Genor has conducted clinical trials for APL-501 in China through Phase 3; and
•CTTQ has conducted clinical trials for APL-502 in China into Phase 3 and approved in China.
Apollomics is not responsible for, and does not have control over, clinical trials conducted by such third parties and does not have any direct financial interest in the development of our product candidates by such third parties. However, the development of our product candidates by such third parties has the potential to benefit the regulatory status and development costs of such product candidates in the geographies and trials for which we are responsible and have control over, due to our ability to access the developmental and clinical data from such third parties and to benefit from the feedback of such trials as information regarding such trials is made available. For more information regarding our arrangements with third parties, please see the section of our Annual Report entitled “Licensing and Collaboration Arrangements.”
Key Components of Our Results of Operations
Operating Expenses
Research and Development Expenses
Research and development expenses consist primarily of costs incurred for our research activities, including our discovery efforts and the development of our product candidates. We expense research and development costs as incurred, which include:
•fees incurred under our agreements with Contract Research Organizations (or CROs), Contract Manufacturing Organizations (or CMOs) and clinical trial sites that conduct research and development activities on our behalf;
•salaries, benefits, and other related costs, including share-based payment expenses, for our personnel engaged in research and development functions;
•service fees incurred under agreements with independent consultants, including their fees and related travel expenses, engaged in research and development functions;
•costs of laboratory supplies and acquiring, developing, and manufacturing study materials; and
•facility-related expenses, which include direct depreciation costs and allocated expenses for rent and maintenance of facilities and other operating costs.
Research and development costs are expensed as incurred. Costs for certain development activities are recognized based on an evaluation of the progress to completion of specific tasks using information and data provided to us by our vendors and our clinical sites.
We cannot determine with certainty the duration and completion costs of the current or future clinical trials of our therapeutic candidates or if, when, or to what extent we will generate revenues from the commercialization and sale of any of our therapeutic candidates for which we or any partner obtain regulatory approval.
The duration, costs and timing of clinical trials and development of therapeutic candidates will depend on a variety of factors, including:
•the scope, rate of progress, and expense of our ongoing, as well as any additional, clinical trials and other research and development activities;
•future clinical trial results;
•potential changes in government regulation; and
•the timing and receipt of any regulatory approvals.
A change in the outcome of any of these variables with respect to the development of a therapeutic candidate could mean a significant change in the costs and timing associated with the development of that therapeutic candidate. For example, if the FDA or another regulatory authority were to require us to conduct clinical trials beyond that which we currently anticipate, or beyond which will be required for the completion of the clinical development of therapeutic candidates, or if we experience significant delays in the enrollment in any clinical trials, we could be required to expend significant additional financial resources and time on the completion of clinical development.
From inception through June 30, 2026, we have incurred $195.0 million in research and development expenses. We plan to increase our research and development expenses for the foreseeable future as we continue the development of our therapeutic candidates, the discovery and development of preclinical therapeutic candidates, and the development of our clinical programs.
We manage certain activities such as clinical trial operations, manufacture of therapeutic candidates, and preclinical animal toxicology studies through third-party CROs. The only costs we track by each therapeutic candidate are external costs such as services provided to us by CROs, manufacturing of preclinical and clinical drug products, and other outsourced research and development expenses. We do not assign or allocate internal costs such as salaries and benefits, facilities costs, lab supplies and the costs of preclinical research and studies to individual development programs.
Research and development activities are central to our business model. As a result of the focus on enrolling new patients with Met Amplification in the SPARTA study and other cost reductions in the SPARTA operations and completion of the uproleselan Phase 3 bridging study in China, we expect that our research and development expenses will decrease in the foreseeable future.
Administrative Expenses
Administrative expenses consist primarily of salaries, benefits, and other related costs, including share-based payment expense, for personnel in our executive, operations, legal, human resources, finance, and administrative functions. Administrative expenses also include professional fees for legal, patent, consulting, accounting, tax and audit services, travel expenses and facility-related expenses, which include direct depreciation costs and allocated expenses for rent and maintenance of facilities, technology, and other operating costs.
We expect that our administrative expenses will decrease substantially in the future in line with our strategic shift, as we decrease our administrative personnel, including the departure of two of our executive officers, and overall reduction of external expenses.
Other Expenses
Other expenses primarily relate to non-operating expenses at the China subsidiary.
Other Income, Gains and Losses
Other Income
Other income primarily includes interest income primarily derived from our cash and cash equivalents.
Foreign Exchange Losses
Foreign exchange losses are a result of foreign exchange rate fluctuation.
Fair Value Change of Financial Liabilities at FVTPL
Fair value change of financial liabilities at FVTPL consists of non-cash gains and losses recognized in profit or loss from remeasuring to fair value at each reporting date (i) our warrant liabilities and (ii) the derivative liability representing the conversion features of the convertible note issued in March 2026. The derivative liability was remeasured at each reporting date while the convertible note was outstanding.
Results of Operations
Comparison of the Six Months Ended June 2025 and 2026
The following table presents Apollomics’ unaudited condensed consolidated statements of operations and comprehensive loss data for the six months ended June 2025 and 2026:
|
|
|
|
|
|
|
|
|
|
|
|
|
|
|
|
|
|
|
Six months ended June 30, |
|
|
Change |
|
(In thousands, except percentages) |
|
2026 |
|
|
2025 |
|
|
$ |
|
|
% |
|
Revenue |
|
$ |
— |
|
|
$ |
8,500 |
|
|
$ |
(8,500 |
) |
|
|
(100 |
)% |
Other income |
|
|
154 |
|
|
|
83 |
|
|
|
71 |
|
|
|
86 |
% |
Foreign exchange losses |
|
|
(42 |
) |
|
|
(77 |
) |
|
|
35 |
|
|
|
(45 |
)% |
Fair value change of financial liabilities at FVTPL |
|
|
(60 |
) |
|
|
(384 |
) |
|
|
324 |
|
|
|
(84 |
)% |
Research and development expenses |
|
|
(1,971 |
) |
|
|
(4,620 |
) |
|
|
2,649 |
|
|
|
(57 |
)% |
Administrative expenses |
|
|
(4,467 |
) |
|
|
(14,488 |
) |
|
|
10,021 |
|
|
|
(69 |
)% |
Impairment of an intangible asset |
|
|
— |
|
|
|
(1,500 |
) |
|
|
1,500 |
|
|
|
(100 |
)% |
Finance costs |
|
|
(87 |
) |
|
|
(35 |
) |
|
|
(52 |
) |
|
|
149 |
% |
Impairment loss on financial assets – expected credit loss |
|
|
(2,300 |
) |
|
|
— |
|
|
|
(2,300 |
) |
|
|
100 |
% |
Other expense |
|
|
— |
|
|
|
(14 |
) |
|
|
14 |
|
|
|
(100 |
)% |
Loss before taxation |
|
|
(8,773 |
) |
|
|
(12,535 |
) |
|
|
3,762 |
|
|
|
(30 |
)% |
Income tax expenses |
|
|
(1 |
) |
|
|
(1 |
) |
|
|
— |
|
|
0% |
|
Loss and total comprehensive loss for the
period, attributable to owners of the
Company |
|
$ |
(8,774 |
) |
|
$ |
(12,536 |
) |
|
$ |
3,762 |
|
|
|
(30 |
)% |
Research and Development
The following table summarizes the components of our research and development expenses for the six months ended June 2025 and 2026:
|
|
|
|
|
|
|
|
|
|
|
|
|
|
|
|
|
|
|
Six months ended June 30, |
|
|
Change |
|
(In thousands, except percentages) |
|
2026 |
|
|
2025 |
|
|
$ |
|
|
% |
|
R&D Third-Party Service Fees and Contractor Expenses: |
|
$ |
(1,764 |
) |
|
$ |
(3,524 |
) |
|
$ |
1,760 |
|
|
|
(50 |
)% |
APL-101 |
|
|
(1,324 |
) |
|
|
(3,190 |
) |
|
|
1,866 |
|
|
|
(58 |
)% |
APL-102 |
|
|
— |
|
|
|
(59 |
) |
|
|
59 |
|
|
|
(100 |
)% |
APL-106 |
|
|
— |
|
|
|
(216 |
) |
|
|
216 |
|
|
|
(100 |
)% |
APL-501 |
|
|
(371 |
) |
|
|
27 |
|
|
|
(398 |
) |
|
|
(1,474 |
)% |
Discovery & other |
|
|
(69 |
) |
|
|
(86 |
) |
|
|
17 |
|
|
|
(20 |
)% |
R&D Employee Compensation and Benefits |
|
|
(165 |
) |
|
|
(308 |
) |
|
|
143 |
|
|
|
(46 |
)% |
R&D Employee Share Based Compensation |
|
|
(42 |
) |
|
|
(788 |
) |
|
|
746 |
|
|
|
(95 |
)% |
Total Research and Development Expenses |
|
$ |
(1,971 |
) |
|
$ |
(4,620 |
) |
|
$ |
2,649 |
|
|
|
(57 |
)% |
Research and development expenses for the six months ended June 30, 2026 were $2.0 million, compared to $4.6 million for the six months ended June 30, 2025. The decrease of $2.6 million (or -57%) is primarily due to the $1.8 million decrease in third party service fees and contractor expenses, the $0.1 million decrease in employee compensation and benefits, and the $0.7 million decrease in employee share-based compensation. The decrease in employee share-based compensation and employee compensation and benefits was primarily attributable to a reduction in headcount. The decrease in third party service fees and contractor expenses was attributable primarily to a decrease in spending on APL-101, APL-102, and APL-106 due to project re-alignment.
We manage our R&D third-party service fees and our contractor expenses by product, which is shown in the table above. We do not allocate our R&D employee compensation and benefits, nor our R&D employee share-based compensation into our product lines.
Administrative Expenses
The following table summarizes the components of our administrative expenses for the six months ended June 30, 2025 and 2026:
|
|
|
|
|
|
|
|
|
|
|
|
|
|
|
|
|
|
|
Six months ended June 30, |
|
|
Change |
|
(In thousands, except percentages) |
|
2026 |
|
|
2025 |
|
|
$ |
|
|
% |
|
Administrative Employee Compensation and Benefits |
|
$ |
(777 |
) |
|
$ |
(1,048 |
) |
|
$ |
271 |
|
|
|
(26 |
)% |
Administrative Employee Share Based Compensation |
|
|
(975 |
) |
|
|
(2,486 |
) |
|
|
1,511 |
|
|
|
(61 |
)% |
Administrative Third-Party Service Fees |
|
|
(1,849 |
) |
|
|
(8,988 |
) |
|
|
7,139 |
|
|
|
(79 |
)% |
Operations |
|
|
(317 |
) |
|
|
(199 |
) |
|
|
(118 |
) |
|
|
59 |
% |
Rental and Maintenance |
|
|
(18 |
) |
|
|
(1 |
) |
|
|
(17 |
) |
|
|
1,700 |
% |
Travel Expenses |
|
|
(48 |
) |
|
|
(24 |
) |
|
|
(24 |
) |
|
|
100 |
% |
Sales and Marketing Expenses |
|
|
(2 |
) |
|
|
(9 |
) |
|
|
7 |
|
|
|
(78 |
)% |
Depreciation |
|
|
(103 |
) |
|
|
(133 |
) |
|
|
30 |
|
|
|
(23 |
)% |
Others |
|
|
(378 |
) |
|
|
(1,600 |
) |
|
|
1,222 |
|
|
|
(76 |
)% |
Total |
|
$ |
(4,467 |
) |
|
$ |
(14,488 |
) |
|
$ |
10,021 |
|
|
|
(69 |
)% |
Administrative expenses for the six months ended June 30, 2026 were $4.5 million, compared to $14.5 million for the six months ended June 30, 2025. The decrease of $10.0 million (or -69%) was primarily due to a $7.1 million decrease in administrative third-party service fees, a $1.5 million decrease in administrative employee share-based compensation for share options granted to incentivize employees, a $1.2 million decrease in other administrative expenses, and a $0.3 million decrease in administrative employee compensation and benefits due to reduced headcount and salary reductions.
Other Expenses
Other expenses for the six months ended June 30, 2026, were nil, compared to $14 thousand for the six months ended June 30, 2025.
Other Income
The following table summarizes the components of our other income for the six months ended June 30, 2025 and 2026:
|
|
|
|
|
|
|
|
|
|
|
|
|
|
|
|
|
|
|
Six months ended June 30, |
|
|
Change |
|
(In thousands, except percentages) |
|
2026 |
|
|
2025 |
|
|
$ |
|
|
% |
|
Interest income |
|
$ |
51 |
|
|
$ |
83 |
|
|
$ |
(32 |
) |
|
|
(39 |
)% |
Other |
|
|
103 |
|
|
|
— |
|
|
|
103 |
|
|
|
100 |
% |
Total |
|
$ |
154 |
|
|
$ |
83 |
|
|
$ |
71 |
|
|
|
86 |
% |
Other income was $154 thousand for the six months ended June 30, 2026, compared to $83 thousand for the six months ended June 30, 2025. The increase of $71 thousand was primarily due to $103 thousand of other income recognized during the six months ended June 30, 2026, resulting from sublease income at our USA subsidiary, partially offset by a $32 thousand decrease in interest income mainly due to lower cash balances held at our Cayman and US entities.
Liquidity and Capital Resources
Funding Requirements
Since our inception, we have incurred significant operating losses. We expect to incur significant expenses and continuing operating losses for the foreseeable future as we advance the clinical development of our programs. We have funded our operations to date primarily with proceeds from sales of our equity securities.
As of June 30, 2026, the Group had cash and cash equivalents of $1.0 million, compared to $3.3 million as of December 31, 2025
We may seek to raise any necessary additional capital through a combination of public or private equity offerings, debt financings, collaborations, strategic alliances, licensing arrangements and other marketing and distribution arrangements. There can be no assurance that we will be successful in acquiring additional funding at levels sufficient to fund our operations or on terms favorable to us. If we are unable to obtain adequate financing when needed, we may have to delay, reduce the scope of
or suspend one or more of our preclinical studies and clinical trials, research and development programs or commercialization efforts. Because of the numerous risks and uncertainties associated with the development and commercialization of our product candidates and the extent to which we may enter into additional collaborations with third parties to participate in their development and commercialization, we are unable to estimate the amounts of increased capital outlays and operating expenditures associated with our current and anticipated preclinical studies and clinical trials. To the extent that we raise additional capital through additional collaborations, strategic alliances, or licensing arrangements with third parties, we may have to relinquish valuable rights to our product candidates, future revenue streams, research programs or product candidates or to grant licenses on terms that may not be favorable to us. If we do raise additional capital through public or private equity or convertible debt offerings, the ownership interest of our existing shareholders will be diluted, and the terms of these securities may include liquidation or other preferences that adversely affect our shareholders’ rights. If we raise additional capital through debt financing, we may be subject to covenants limiting or restricting our ability to take specific actions, such as incurring additional debt, making capital expenditures, or declaring dividends.
We have evaluated whether there are material uncertainties’ related to events or conditions that may cast significant doubt upon our ability to continue as a going concern within one year after the date of these financial statements.
As of and for the six months ended June 30, 2026, the Group had reported a net loss of $8.8 million, and accumulated losses of $720.5 million and net current liabilities of $9.6 million. The Group regularly monitors its current and expected liquidity requirements and, as needed, updates its operating plans, to ensure that it maintains sufficient cash balances to meet its liquidity requirements in the short and long term. Based on our evaluation of conditions and events as of June 30, 2026, management has determined that substantial doubt exists about the Company’s ability to continue as a going concern. As of that date, we had cash and cash equivalents of $1.0 million, a history of recurring losses and negative shareholders’ equity, and limited liquidity relative to our operating requirements. Although we implemented cost-reduction initiatives beginning in early 2024 and continuing through 2026, and expect liquidity support from financing activities and strategic partnerships, our existing cash resources are not sufficient to meet our obligations as they come due for at least twelve months from the end of the reporting period. Management’s plans to address this shortfall include raising additional capital through equity or debt financing and generating cash inflows from strategic partnerships; however, these plans are not contractually committed, are subject to external factors and there can be no assurance that it will be available on acceptable terms, or at all. These conditions indicate the existence of material uncertainties that may cast substantial doubt on the Company’s ability to continue as a going concern.
Notwithstanding these material uncertainties, the accompanying financial statements have been prepared on a going concern basis of accounting and do not include any adjustments to the carrying amounts and classification of assets and liabilities that may be necessary in the event that the Company is no longer able to continue its operations as a going concern.
Cash Flows
The following table summarizes our cash flows for the six months ended June 30, 2025 and 2026:
|
|
|
|
|
|
|
|
|
|
|
For the six months ended June 30, |
|
(In thousands) |
|
2026 |
|
|
2025 |
|
Net cash used in operating activities |
|
$ |
(4,297 |
) |
|
$ |
(7,624 |
) |
Net cash provided by investing activities |
|
|
— |
|
|
|
48 |
|
Net cash (used in) or provided by financing activities |
|
|
2,031 |
|
|
|
(82 |
) |
Effects of exchange rate changes on cash and cash equivalents |
|
|
1 |
|
|
|
(14 |
) |
Net change in cash and cash equivalents |
|
$ |
(2,265 |
) |
|
$ |
(7,672 |
) |
Cash Flows Used in Operating Activities
Our cash flows from operating activities are significantly affected by the growth of our business, and are primarily related to research and development, and administrative expenses. Our operating cash flows are also affected by our working capital needs to support growth in personnel-related expenditures and fluctuations in accounts payable, accounts receivable and other current assets and liabilities.
Net cash used in operating activities was $(7.6) million for the six months ended June 30, 2025 resulting primarily from a net loss of $(12.5) million, adjusted for non-cash charges of $0.1 million in depreciation and amortization, including depreciation of operating right-of-use assets, $1.5 million of impairment charges on intangible assets, $0.4 million in fair value change of financial liabilities at FVTPL, $3.3 million in share-based payments, and $(0.4) million in working capital adjustments.
Net cash used in operating activities was $4.3 million for the six months ended June 30, 2026 resulting primarily from a net loss of $8.8 million, adjusted for non-cash charges of $0.1 million in depreciation and amortization, including depreciation of operating right-of-use of assets, $2.3 million in impairment loss on financial assets (expected credit loss), $0.1 million in fair value change of financial liabilities at FVTPL, $0.1 million in finance costs (primarily non-cash interest on the Convertible Note), $1.0 million in share-based payments, and $0.9 million in working capital adjustments.
Cash Flows Provided by Investing Activities
Net cash provided by investing activities was $48 thousand for the six months ended June 30, 2025 resulting primarily from proceeds from disposal of plant and equipment.
Net cash provided by investing activities was nil for the six months ended June 30, 2026.
Cash Flows Used in/Provided by Financing Activities
Net cash used in financing activities was $0.1 million for the six months ended June 30, 2025 resulting primarily from the repayment of lease liabilities of $(47) thousand and payment of interest of $(35) thousand.
Net cash provided by financing activities was $2.0 million for the six months ended June 30, 2026 resulting primarily from proceeds from the issuance of a convertible note of $2.0 million and proceeds from the exercise of share options of $0.2 million, partially offset by the repayment of lease liabilities of $(103) thousand and payment of interest of $(25) thousand.
Effects of Exchange Rate Changes on Cash and Cash Equivalents
Effects of exchange rate changes on cash and cash equivalents were insignificant for the six months ended June 30, 2025 and 2026.
Contractual Obligations and Commitments
The following table summarizes our contractual obligations as of June 30, 2026, and the effects such obligations are expected to have on our liquidity and cash flow in future periods (in thousands):
|
|
|
|
|
|
|
|
|
|
|
|
|
|
|
|
|
|
|
|
|
|
|
Payments due by period |
|
(In thousands) |
|
Total |
|
|
Less than 1 year |
|
|
1-2 years |
|
|
3-5 years |
|
|
More than 5 years |
|
Lease commitments |
|
$ |
589 |
|
|
$ |
205 |
|
|
$ |
254 |
|
|
$ |
130 |
|
|
$ |
— |
|
Legal commitments |
|
|
4,000 |
|
|
|
2,500 |
|
|
|
1,500 |
|
|
|
— |
|
|
|
— |
|
Convertible note principal |
|
|
2,000 |
|
|
|
— |
|
|
|
2,000 |
|
|
|
— |
|
|
|
— |
|
Lease Commitments
Lease agreements are entered into for fixed lease terms of 12 to 60 months, without extension and termination options. Lease terms are negotiated on an individual basis and contain a wide range of different terms and conditions. In determining the lease term and assessing the length of the non-cancellable period, the Group applies the definition of a contract and determines the period for which the contract is enforceable. As of June 30, 2025 the Group had right-of-use assets of $0.7 million and lease liabilities of $0.7 million, and as of June 30, 2026 had right-of-use assets of $0.5 million and lease liabilities of $0.5 million. During the six months ended June 30, 2025, the Group derecognized right-of-use assets and lease liabilities totaling $0.1 million following the early termination of a lease. There were no such derecognitions during the six months ended June 30, 2026.
Legal Commitments
On November 19, 2025, the Group entered into a settlement agreement to fully resolve and conclude all matters related to legal claims described in Note 14. Under the terms of the agreement, the Group agreed to pay $5.0 million in cash and approximately $0.9 million in associated legal expenses.
As of June 30, 2026, $4.0 million of the settlement obligation remains unpaid. Based on the payment due dates, $2.5 million of the settlement obligation is included in other payables and accruals, with the remaining $1.5 million classified as other non-current liabilities in the statement of financial position.
Convertible Note
On March 30, 2026, the Company issued a $2.0 million unsecured convertible promissory note (the “Convertible Note”) to its Chairman and Chief Executive Officer. The Convertible Note bears no interest and was scheduled to mature on September
30, 2027; the contractual obligations table above presents the $2.0 million principal amount in the 1-2 years column based on that maturity date. On August 14, 2026, in connection with the closing of the Private Placement, the Convertible Note converted in full into 166,667 Class A ordinary shares at a conversion price of $12.00 per share, and no principal amount remains payable in cash. The derivative liability representing the conversion features of the Convertible Note (carrying amount of $732 thousand as of June 30, 2026) is not included in the table because it is not settled in cash; it was settled through the issuance of shares upon conversion. See Notes 15, 18 and 22.
Off-Balance Sheet Arrangements
We did not have during the periods presented, and we do not currently have, any off-balance sheet arrangements that have, or are reasonably likely to have, a current or future significant effect on our financial condition, results of operations, liquidity, or cash flows.
Emerging Growth Company
As defined in Section 102(b)(1) of the JOBS Act (the “JOBS Act”), we are an emerging growth company (“EGC”). As such, we will be eligible for and intends to rely on certain exemptions and reduced reporting requirements provided by the JOBS Act, including (a) the exemption from the auditor attestation requirements with respect to internal control over financial reporting under Section 404(b) of the Sarbanes-Oxley Act, (b) the exemptions from say-on-pay, say-on-frequency and say-on-golden parachute voting requirements and (c) reduced disclosure obligations regarding executive compensation in its periodic reports and proxy statements.
We will remain an EGC under the JOBS Act until the earliest of (i) the last day of the fiscal year in which the market value of our Class A Ordinary Shares that are held by non-affiliates exceeds $700 million as of the last business day of the second quarter of that fiscal year, (ii) the last day of the fiscal year in which it has total annual gross revenue of $1.235 billion or more during such fiscal year (as indexed for inflation), (iii) the date on which it was issued more than $1 billion in non-convertible debt in the prior three-year period or (iv) the last day of the fiscal year following the fifth anniversary of the date of the first sale of Class A Ordinary Shares following the consummation of the business combination with Maxpro Capital Acquisition Corp.
Critical Accounting Policies and Estimates
This MD&A is based on our condensed consolidated interim financial statements, which have been prepared in accordance with accounting policies that conform with International Financial Reporting Standards (“IFRS”) issued by the International Accounting Standards Board (“IASB”). In the application of our accounting policies, our management is required to make judgments, estimates and assumptions about the carrying amounts of assets and liabilities that are not readily apparent from other sources. The estimates and underlying assumptions are based on historical experience and other factors that are considered to be relevant. Our actual results may differ from these estimates. The estimates and underlying assumptions are reviewed on an ongoing basis. Revisions to accounting estimates are recognized in the period in which the estimate is revised if the revision affects only that period, or in the period of the revision and future periods if the revision affects both current and future periods.
Our most critical accounting policies and estimates are discussed below. Please refer to Note 4 to our unaudited condensed consolidated interim financial statements included elsewhere in this filing for more details about our significant accounting policies and critical judgment and key estimates.
Impairment of financial assets
The Company performs impairment assessment under expected credit loss (“ECL”) model on financial assets (including deposits, time deposits with original maturity over three months and cash and cash equivalents) which are subject to impairment under IFRS 9. The amount of ECL is updated at each reporting date to reflect changes in credit risk since initial recognition.
Lifetime ECL represents the ECL that will result from all possible default events over the expected life of the relevant instrument. In contrast,12-month ECL represents the portion of lifetime ECL that is expected to result from default events that are possible within 12 months after the reporting date. Assessments are done based on the Company’s historical credit loss experience, adjusted for factors that are specific to the debtors, general economic conditions and an assessment of both the current conditions at the reporting date as well as the forecast of future conditions.
For all financial instruments, the Company measures the loss allowance equal to 12-month ECL, unless when there has been a significant increase in credit risk since initial recognition, the Company recognizes lifetime ECL. The assessment of whether lifetime ECL should be recognized is based on significant increases in the likelihood or risk of a default occurring since initial recognition.
New Accounting Pronouncements
See Note 3, Principal Accounting Policies, to our unaudited condensed consolidated interim financial statements included elsewhere in this filing.
Quantitative and Qualitative Disclosures about Market Risk
We are exposed to a variety of market risks, including currency risk, concentration risks, interest rate risk, other price risk, credit and counterparty risk and liquidity risk, as set out below. We manage and monitor these exposures to ensure appropriate measures are implemented in a timely and effective manner. Save as disclosed below, we did not hedge or consider necessary to hedge any of these risks.
Currency Risk
Foreign currency risk is the risk that the value of a financial instrument fluctuates because of the change in foreign exchange rates. We primarily operate in the United States, PRC, Hong Kong, Taiwan and Australia, with most of the transactions settled in the U.S. dollar. Our presentation and functional currency is the U.S. dollar. Certain bank balances, deposits and other payables are denominated in Renminbi, Australian Dollars, Hong Kong Dollars, and New Taiwan Dollars, which exposes us to foreign currency risk.
Our exposure to foreign exchange risk arises primarily from Renminbi, Australian Dollar, Hong Kong Dollar and New Taiwan Dollar denominated balances, which are presented in the table below excluding intercompany balances. Based on the sensitivity analysis below, a 5% change in any of these currencies against the U.S. dollar would change our loss by less than $0.1 million, and we therefore do not consider our foreign exchange risk to be significant. We did not use any derivative contracts to hedge against our exposure to currency risk during the six months ended June 30, 2025 or 2026. However, our management monitors foreign exchange exposure and will consider hedging significant foreign currency exposure should the need arise.
The carrying amounts of our foreign currency denominated assets and monetary liabilities at the end of each reporting period are as follows:
|
|
|
|
|
|
|
|
|
|
|
|
|
|
|
|
|
|
|
Assets |
|
|
Liabilities |
|
|
|
As of June 30, |
|
|
As of June 30, |
|
(In thousands) |
|
2026 |
|
|
2025 |
|
|
2026 |
|
|
2025 |
|
Renminbi (“RMB”) |
|
$ |
740 |
|
|
$ |
1,300 |
|
|
$ |
556 |
|
|
$ |
776 |
|
Australian Dollars (“AUD”) |
|
|
69 |
|
|
|
100 |
|
|
|
1,471 |
|
|
|
1,069 |
|
Hong Kong Dollars (“HKD”) |
|
|
42 |
|
|
|
5 |
|
|
|
753 |
|
|
|
750 |
|
New Taiwan Dollars (“TWD”) |
|
|
124 |
|
|
|
— |
|
|
|
26 |
|
|
|
— |
|
|
|
$ |
975 |
|
|
$ |
1,405 |
|
|
$ |
2,806 |
|
|
$ |
2,595 |
|
As of June 30, 2025 and 2026, (i) if Renminbi strengthened or weakened by 5% against the U.S. dollar with all other variables held constant, our loss for the six months ended June 30, 2025 and 2026 would decrease or increase by $26 thousand and decrease or increase by $9 thousand, respectively; (ii) if the Australian Dollar strengthened or weakened by 5% against the U.S. dollar with all other variables held constant, our loss for the six months ended June 30, 2025 and 2026 would increase or decrease by $48 thousand and increase or decrease by $70 thousand, respectively, (iii) if the Hong Kong Dollar strengthened or weakened by 5% against the U.S. dollar with all other variables held constant, our loss for the six months ended June 30, 2025 and 2026 would increase or decrease by $37 thousand and increase or decrease by $36 thousand, respectively, and (iv) if the New Taiwan Dollar strengthened or weakened by 5% against the U.S. dollar with all other variables held constant, our loss
for the six months ended June 30, 2025 and 2026 would decrease or increase by nil and decrease or increase by $5 thousand, respectively.
Concentration of Risks
The carrying amounts of financial instruments that potentially subject us to significant concentration of credit risk primarily consist of cash and cash equivalents. As of December 31, 2025 and June 30, 2026, we had RMB 4.3 million ($0.6 million) in cash and cash equivalents, and RMB 3.7 million ($0.5 million), respectively, in cash and cash equivalents which are held by financial institutions in the PRC. We continue to monitor the financial strength of the four financial institutions in the PRC where we hold our cash and cash equivalents. PRC state-owned banks are subject to a series of risk control regulatory standards, and PRC bank regulatory authorities are empowered to take over the operation and management when any of those banks faces a material credit crisis. We do not foresee substantial credit risk with respect to cash and cash equivalents held at these PRC state-owned banks. Meanwhile, the PRC does not have an official deposit insurance program, nor does it have an agency similar to what was the Federal Deposit Insurance Corporation (FDIC) in the U.S. In the event of bankruptcy of one of the financial institutions in which we have deposits or investments, we may be unlikely to claim our deposits or investments back in full. We selected reputable PRC financial institutions with high ratings to place our foreign currencies. We regularly monitor the rating of these PRC financial institutions to avoid any potential defaults. There has been no recent history of default in relation to these financial institutions.
Interest Rate Risk
We are exposed to fair value interest rate risk in relation to time deposits and lease liabilities. We are also exposed to cash flow interest rate risk in relation to variable-rate bank balances. Our cash flow interest rate risk is mainly concentrated on the fluctuation of interest rates on bank balances. Our management considers that the exposure of cash flow interest rate risk arising from variable-rate bank balances is insignificant.
Other Price Risk
We are exposed to fair value interest rate risk in relation to time deposits and lease liabilities. We are also exposed to cash flow interest rate risk in relation to variable-rate bank balances. Our cash flow interest rate risk is mainly concentrated on the fluctuation of interest rates on bank balances. We consider that the exposure of cash flow interest rate risk arising from variable-rate bank balances is insignificant.
Credit and Counterparty Risk
Credit and counterparty risk refers to the risk that a counterparty will default on its contractual obligations resulting in financial loss to us. In order to minimize the credit risk, we review the recoverable amount of each individual debt at the end of each reporting period to ensure that adequate impairment losses are made for irrecoverable amounts. In this regard, we consider that our credit and counterparty risk is significantly reduced.
Liquidity Risk
As of June 30, 2026, we recorded net liabilities of $11.2 million. In the management of liquidity risk, we have reviewed our cash flow projections to ensure we maintain a level of cash and cash equivalents deemed adequate by the management to finance our operations and mitigate the effects of fluctuations in cash flows.
The following table details the remaining contractual maturity for our non-derivative financial liabilities and lease liabilities. The table has been drawn up based on the undiscounted cash flows of financial liabilities based on the earliest date on which we can be required to pay. The table includes both interest and principal cash flows. To the extent that interest flows are a floating rate, the undiscounted amount is derived from the interest rate at the end of each reporting period.
|
|
|
|
|
|
|
|
|
|
|
|
|
|
|
|
|
|
|
|
|
|
|
|
|
|
|
|
|
|
|
(In thousands, except percentages) |
|
|
|
|
|
|
|
|
|
|
|
|
|
|
|
|
|
|
|
|
|
|
|
Weighted average
interest rate |
|
% |
|
On demand or less than 1 month |
|
|
1 to 3 months |
|
|
3 months to 1 year |
|
|
1 to 2 years |
|
|
2 to 4 years |
|
|
Total undiscounted cash flows |
|
|
Carrying amount |
|
June 30, 2026 |
|
|
|
|
|
|
|
|
|
|
|
|
|
|
|
|
|
|
|
|
|
|
|
Other Payables |
|
N/A |
|
$ |
— |
|
|
$ |
6,526 |
|
|
$ |
— |
|
|
$ |
— |
|
|
$ |
— |
|
|
$ |
6,526 |
|
|
$ |
6,526 |
|
Legal liabilities |
|
N/A |
|
|
— |
|
|
|
— |
|
|
|
2,500 |
|
|
|
1,500 |
|
|
|
— |
|
|
|
4,000 |
|
|
|
4,000 |
|
Convertible note, related party |
|
16.2 |
|
|
— |
|
|
|
— |
|
|
|
— |
|
|
|
2,000 |
|
|
|
— |
|
|
|
2,000 |
|
|
|
1,658 |
|
Total |
|
|
|
|
— |
|
|
|
6,526 |
|
|
|
2,500 |
|
|
|
3,500 |
|
|
|
— |
|
|
|
12,526 |
|
|
|
12,184 |
|
Lease liabilities |
|
6.63 |
|
$ |
- |
|
|
$ |
61 |
|
|
$ |
144 |
|
|
$ |
254 |
|
|
$ |
130 |
|
|
|
589 |
|
|
|
541 |
|
